
- PREMIUM
- LIVE QUOTES
- INSTITUTIONS
 Index Options
 State Street
 CME Group
 Nasdaq
 Cboe
Cboe TradingView
 Wall Street Journal
Beyond The Numbers: 7 Analysts Discuss LPL Finl Hldgs Stock
LPL Finl Hldgs (NASDAQ:LPLA) underwent analysis by 7 analysts in the last quarter, revealing a spectrum of viewpoints from bullish to bearish.
The following table encapsulates their recent ratings, offering a glimpse into the evolving sentiments over the past 30 days and comparing them to the preceding months.
| Bullish | Somewhat Bullish | Indifferent | Somewhat Bearish | Bearish | |
|---|---|---|---|---|---|
| Total Ratings | 1 | 6 | 0 | 0 | 0 |
| Last 30D | 0 | 1 | 0 | 0 | 0 |
| 1M Ago | 0 | 2 | 0 | 0 | 0 |
| 2M Ago | 1 | 3 | 0 | 0 | 0 |
| 3M Ago | 0 | 0 | 0 | 0 | 0 |
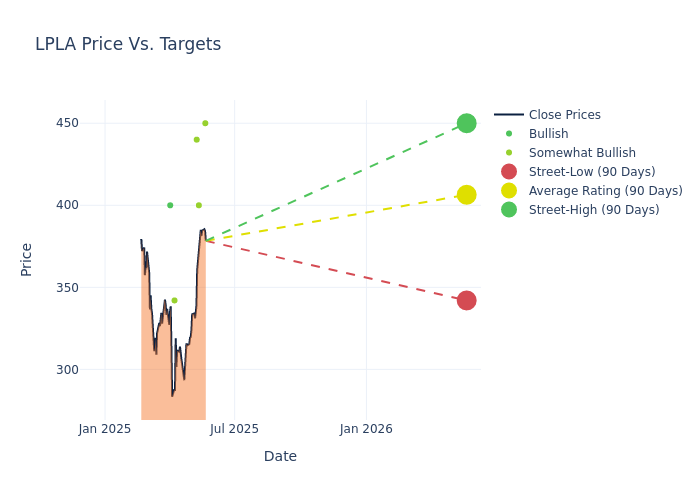
Providing deeper insights, analysts have established 12-month price targets, indicating an average target of $402.43, along with a high estimate of $450.00 and a low estimate of $342.00. Observing a 1.19% increase, the current average has risen from the previous average price target of $397.71.
Investigating Analyst Ratings: An Elaborate Study
The perception of LPL Finl Hldgs by financial experts is analyzed through recent analyst actions. The following summary presents key analysts, their recent evaluations, and adjustments to ratings and price targets.
| Analyst | Analyst Firm | Action Taken | Rating | Current Price Target | Prior Price Target |
|---|---|---|---|---|---|
| Michael Cyprys | Morgan Stanley | Raises | Overweight | $450.00 | $330.00 |
| Benjamin Budish | Barclays | Raises | Overweight | $400.00 | $365.00 |
| Devin Ryan | JMP Securities | Raises | Market Outperform | $440.00 | $420.00 |
| Michael Brown | Wells Fargo | Lowers | Overweight | $342.00 | $405.00 |
| Devin Ryan | JMP Securities | Lowers | Market Outperform | $420.00 | $435.00 |
| Benjamin Budish | Barclays | Lowers | Overweight | $365.00 | $414.00 |
| Christopher Allen | Citigroup | Lowers | Buy | $400.00 | $415.00 |
Key Insights:
- Action Taken: In response to dynamic market conditions and company performance, analysts update their recommendations. Whether they 'Maintain', 'Raise', or 'Lower' their stance, it signifies their reaction to recent developments related to LPL Finl Hldgs. This insight gives a snapshot of analysts' perspectives on the current state of the company.
- Rating: Analysts unravel qualitative evaluations for stocks, ranging from 'Outperform' to 'Underperform'. These ratings offer insights into expectations for the relative performance of LPL Finl Hldgs compared to the broader market.
- Price Targets: Analysts navigate through adjustments in price targets, providing estimates for LPL Finl Hldgs's future value. Comparing current and prior targets offers insights into analysts' evolving expectations.
To gain a panoramic view of LPL Finl Hldgs's market performance, explore these analyst evaluations alongside essential financial indicators. Stay informed and make judicious decisions using our Ratings Table.
Stay up to date on LPL Finl Hldgs analyst ratings.
Unveiling the Story Behind LPL Finl Hldgs
LPL Financial Holdings is an independent broker/dealer that provides a platform of proprietary technology, brokerage, and investment advisory services to financial advisors and institutions. As of the end of 2024, the company had over 29,000 advisors on its platform managing $1.7 trillion of client assets. The company doesn't have material operations outside the United States.
Breaking Down LPL Finl Hldgs's Financial Performance
Market Capitalization Analysis: The company exhibits a lower market capitalization profile, positioning itself below industry averages. This suggests a smaller scale relative to peers.
Revenue Growth: LPL Finl Hldgs's remarkable performance in 3M is evident. As of 31 March, 2025, the company achieved an impressive revenue growth rate of 29.56%. This signifies a substantial increase in the company's top-line earnings. In comparison to its industry peers, the company stands out with a growth rate higher than the average among peers in the Financials sector.
Net Margin: LPL Finl Hldgs's net margin lags behind industry averages, suggesting challenges in maintaining strong profitability. With a net margin of 8.68%, the company may face hurdles in effective cost management.
Return on Equity (ROE): LPL Finl Hldgs's ROE stands out, surpassing industry averages. With an impressive ROE of 10.52%, the company demonstrates effective use of equity capital and strong financial performance.
Return on Assets (ROA): LPL Finl Hldgs's ROA stands out, surpassing industry averages. With an impressive ROA of 2.34%, the company demonstrates effective utilization of assets and strong financial performance.
Debt Management: With a below-average debt-to-equity ratio of 1.91, LPL Finl Hldgs adopts a prudent financial strategy, indicating a balanced approach to debt management.
How Are Analyst Ratings Determined?
Benzinga tracks 150 analyst firms and reports on their stock expectations. Analysts typically arrive at their conclusions by predicting how much money a company will make in the future, usually the upcoming five years, and how risky or predictable that company's revenue streams are.
Analysts attend company conference calls and meetings, research company financial statements, and communicate with insiders to publish their ratings on stocks. Analysts typically rate each stock once per quarter or whenever the company has a major update.
Beyond their standard evaluations, some analysts contribute predictions for metrics like growth estimates, earnings, and revenue, furnishing investors with additional guidance. Users of analyst ratings should be mindful that this specialized advice is shaped by human perspectives and may be subject to variability.
Which Stocks Are Analysts Recommending Now?
Benzinga Edge gives you instant access to all major analyst upgrades, downgrades, and price targets. Sort by accuracy, upside potential, and more. Click here to stay ahead of the market.
This article was generated by Benzinga's automated content engine and reviewed by an editor.