
- PREMIUM
- LIVE QUOTES
- INSTITUTIONS
 Index Options
 State Street
 CME Group
 Nasdaq
 Cboe
Cboe TradingView
 Wall Street Journal
3 Stocks Estimated To Be Trading Up To 49.2% Below Intrinsic Value
The United States market has experienced a positive trend, climbing 2.9% in the last week and showing a 12% increase over the past year, with earnings projected to grow by 14% annually. In this environment, identifying stocks that are trading below their intrinsic value can present opportunities for investors seeking to capitalize on potential growth while maintaining a focus on fundamental value.
Top 10 Undervalued Stocks Based On Cash Flows In The United States
| Name | Current Price | Fair Value (Est) | Discount (Est) |
| Quaker Chemical (NYSE:KWR) | $106.86 | $210.36 | 49.2% |
| Super Group (SGHC) (NYSE:SGHC) | $8.38 | $16.52 | 49.3% |
| Valley National Bancorp (NasdaqGS:VLY) | $9.16 | $18.14 | 49.5% |
| Flowco Holdings (NYSE:FLOC) | $19.08 | $37.91 | 49.7% |
| First Reliance Bancshares (OTCPK:FSRL) | $9.35 | $18.49 | 49.4% |
| Curbline Properties (NYSE:CURB) | $23.74 | $47.17 | 49.7% |
| Carvana (NYSE:CVNA) | $299.89 | $587.44 | 48.9% |
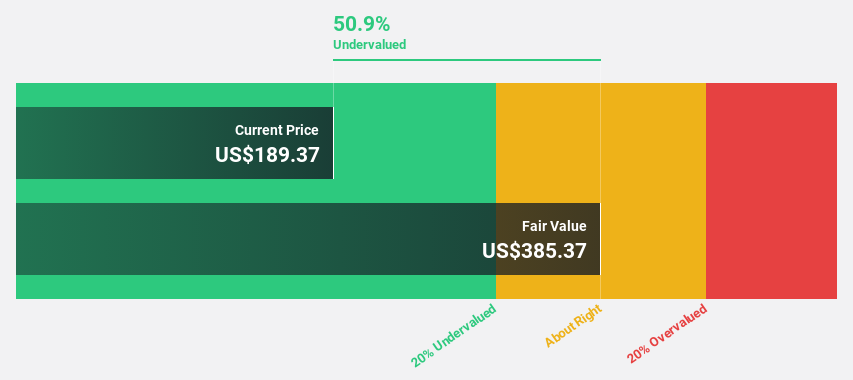
| Constellation Brands (NYSE:STZ) | $195.62 | $385.37 | 49.2% |
| ZEEKR Intelligent Technology Holding (NYSE:ZK) | $29.34 | $58.09 | 49.5% |
| Mobileye Global (NasdaqGS:MBLY) | $15.96 | $31.08 | 48.6% |
Let's uncover some gems from our specialized screener.
Kyndryl Holdings (NYSE:KD)
Overview: Kyndryl Holdings, Inc. is a global technology services and IT infrastructure provider with a market cap of approximately $9.41 billion.
Operations: The company's revenue segments are comprised of $2.36 billion from Japan, $3.88 billion from the United States, $5.21 billion from Principal Markets, and $3.62 billion from Strategic Markets.
Estimated Discount To Fair Value: 41.4%
Kyndryl Holdings is trading at US$40.46, significantly below its estimated fair value of US$69.02, indicating potential undervaluation based on cash flows. Despite high debt levels and slower revenue growth forecasts compared to the market, Kyndryl's earnings are projected to grow substantially at 39.57% annually over the next three years, outpacing market expectations. Recent leadership changes and strategic partnerships aim to enhance its service offerings and drive further growth in AI and data security solutions.
- The analysis detailed in our Kyndryl Holdings growth report hints at robust future financial performance.
- Click here to discover the nuances of Kyndryl Holdings with our detailed financial health report.
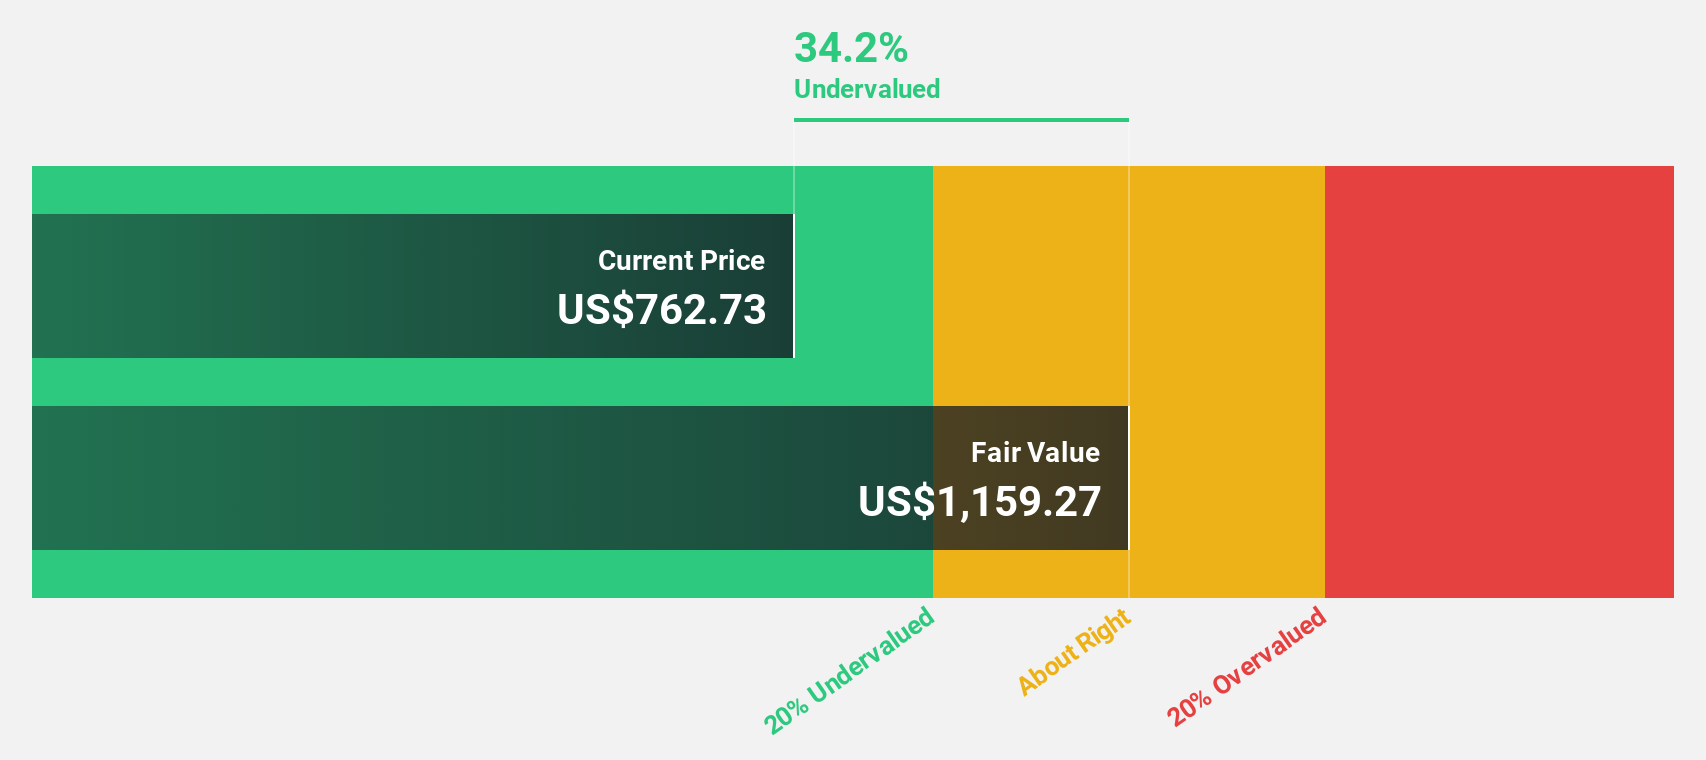
Eli Lilly (NYSE:LLY)
Overview: Eli Lilly and Company is engaged in the discovery, development, and marketing of human pharmaceuticals across the United States, Europe, China, Japan, and internationally with a market cap of approximately $679.94 billion.
Operations: The company's revenue primarily comes from the discovery, development, manufacturing, marketing, and sales of pharmaceutical products, totaling $49.00 billion.
Estimated Discount To Fair Value: 35.3%
Eli Lilly is trading at US$757.39, significantly below its estimated fair value of US$1,171.10, suggesting undervaluation based on cash flows. The company's earnings grew by 80.9% last year and are expected to continue growing at 22.5% annually, outpacing the broader U.S. market forecast of 14.3%. Eli Lilly's recent clinical trial successes with Zepbound and strategic collaborations in RNA-targeted therapies further bolster its growth prospects despite a high debt level and revised lower EPS guidance for 2025.
- In light of our recent growth report, it seems possible that Eli Lilly's financial performance will exceed current levels.
- Dive into the specifics of Eli Lilly here with our thorough financial health report.
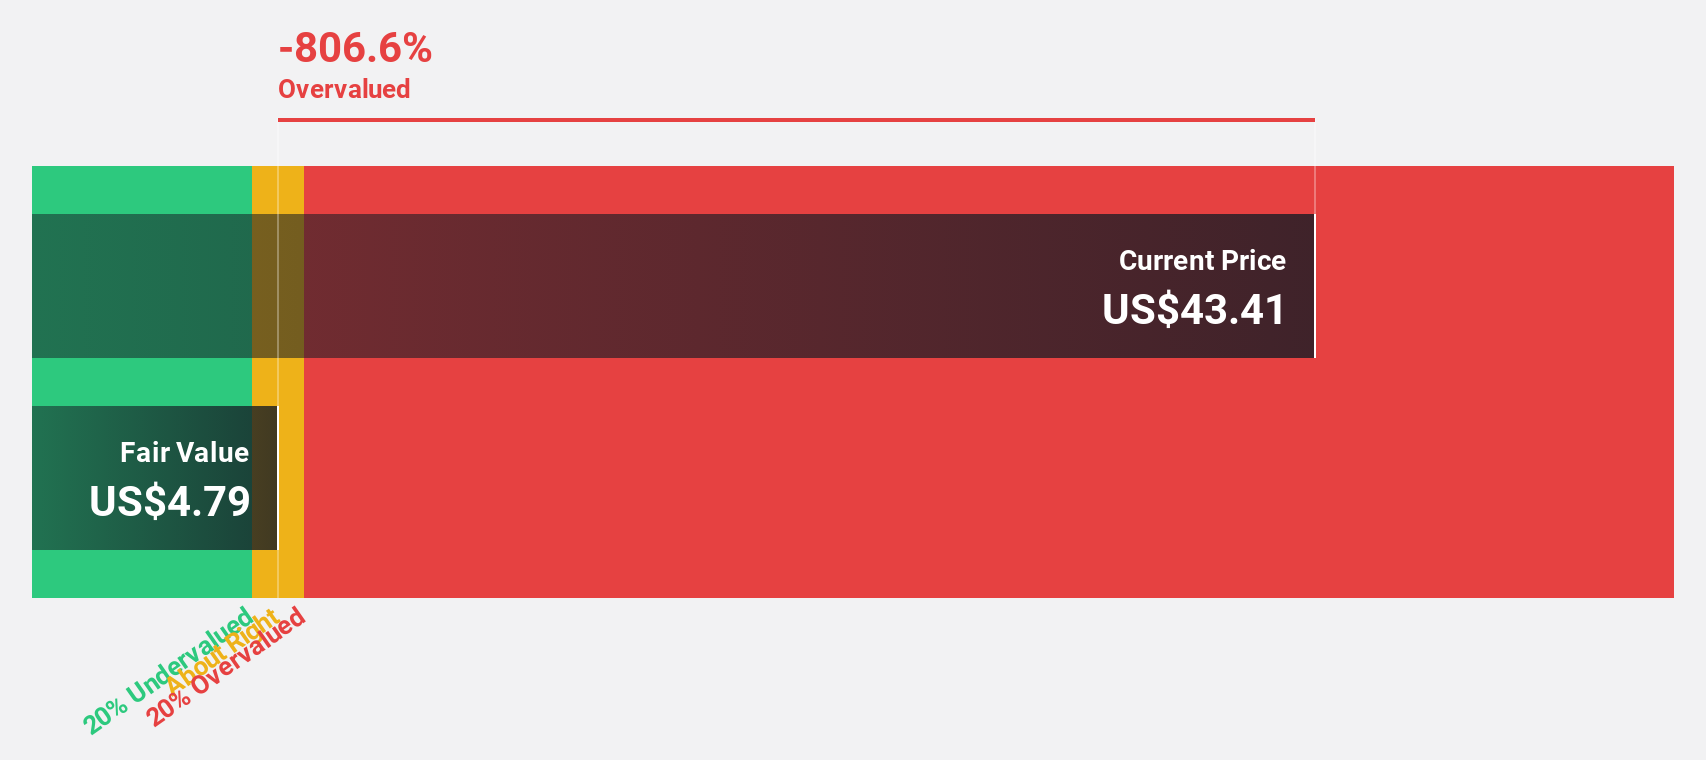
Constellation Brands (NYSE:STZ)
Overview: Constellation Brands, Inc. is a company that produces, imports, markets, and sells beer, wine, and spirits across the United States, Canada, Mexico, New Zealand, and Italy with a market cap of approximately $34.82 billion.
Operations: The company's revenue is primarily derived from its beer segment, which accounts for $8.54 billion, followed by the wine and spirits segment at $1.67 billion.
Estimated Discount To Fair Value: 49.2%
Constellation Brands, trading at US$195.62, is significantly undervalued based on cash flows with an estimated fair value of US$385.37. Despite high debt levels, the company is expected to achieve profitability within three years and has a strong projected earnings growth of 25.86% annually. Recent financial maneuvers include a US$500 million term loan for corporate purposes and a share buyback program worth up to US$4 billion, reflecting strategic capital management amidst slower revenue growth forecasts than the U.S. market average.
- Our comprehensive growth report raises the possibility that Constellation Brands is poised for substantial financial growth.
- Navigate through the intricacies of Constellation Brands with our comprehensive financial health report here.
Next Steps
- Delve into our full catalog of 173 Undervalued US Stocks Based On Cash Flows here.
- Already own these companies? Link your portfolio to Simply Wall St and get alerts on any new warning signs to your stocks.
- Join a community of smart investors by using Simply Wall St. It's free and delivers expert-level analysis on worldwide markets.
Looking For Alternative Opportunities?
- Explore high-performing small cap companies that haven't yet garnered significant analyst attention.
- Diversify your portfolio with solid dividend payers offering reliable income streams to weather potential market turbulence.
- Fuel your portfolio with companies showing strong growth potential, backed by optimistic outlooks both from analysts and management.
This article by Simply Wall St is general in nature. We provide commentary based on historical data and analyst forecasts only using an unbiased methodology and our articles are not intended to be financial advice. It does not constitute a recommendation to buy or sell any stock, and does not take account of your objectives, or your financial situation. We aim to bring you long-term focused analysis driven by fundamental data. Note that our analysis may not factor in the latest price-sensitive company announcements or qualitative material. Simply Wall St has no position in any stocks mentioned.
Have feedback on this article? Concerned about the content? Get in touch with us directly. Alternatively, email editorial-team@simplywallst.com