
retail investors who own 47% along with institutions invested in YONEX Co., Ltd. (TSE:7906) saw increase in their holdings value last week
Key Insights
- YONEX's significant retail investors ownership suggests that the key decisions are influenced by shareholders from the larger public
- The top 18 shareholders own 50% of the company
- 14% of YONEX is held by insiders
A look at the shareholders of YONEX Co., Ltd. (TSE:7906) can tell us which group is most powerful. The group holding the most number of shares in the company, around 47% to be precise, is retail investors. Put another way, the group faces the maximum upside potential (or downside risk).
Retail investors gained the most after market cap touched JP¥191b last week, while institutions who own 19% also benefitted.
In the chart below, we zoom in on the different ownership groups of YONEX.
Check out our latest analysis for YONEX

What Does The Institutional Ownership Tell Us About YONEX?
Institutions typically measure themselves against a benchmark when reporting to their own investors, so they often become more enthusiastic about a stock once it's included in a major index. We would expect most companies to have some institutions on the register, especially if they are growing.
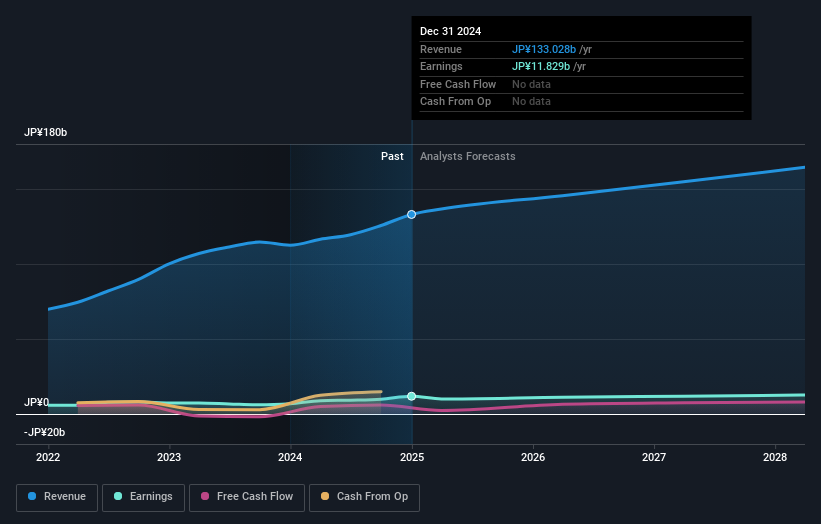
As you can see, institutional investors have a fair amount of stake in YONEX. This suggests some credibility amongst professional investors. But we can't rely on that fact alone since institutions make bad investments sometimes, just like everyone does. When multiple institutions own a stock, there's always a risk that they are in a 'crowded trade'. When such a trade goes wrong, multiple parties may compete to sell stock fast. This risk is higher in a company without a history of growth. You can see YONEX's historic earnings and revenue below, but keep in mind there's always more to the story.
Hedge funds don't have many shares in YONEX. Our data shows that Yonex Sports Development Foundation, Endowment Arm is the largest shareholder with 11% of shares outstanding. With 5.6% and 5.0% of the shares outstanding respectively, Fidelity International Ltd and Shuichi Yoneyama are the second and third largest shareholders. Shuichi Yoneyama, who is the third-largest shareholder, also happens to hold the title of Member of the Board of Directors.
Looking at the shareholder registry, we can see that 50% of the ownership is controlled by the top 18 shareholders, meaning that no single shareholder has a majority interest in the ownership.
While studying institutional ownership for a company can add value to your research, it is also a good practice to research analyst recommendations to get a deeper understand of a stock's expected performance. Quite a few analysts cover the stock, so you could look into forecast growth quite easily.
Insider Ownership Of YONEX
The definition of an insider can differ slightly between different countries, but members of the board of directors always count. The company management answer to the board and the latter should represent the interests of shareholders. Notably, sometimes top-level managers are on the board themselves.
Insider ownership is positive when it signals leadership are thinking like the true owners of the company. However, high insider ownership can also give immense power to a small group within the company. This can be negative in some circumstances.
Our most recent data indicates that insiders own a reasonable proportion of YONEX Co., Ltd.. Insiders own JP¥27b worth of shares in the JP¥191b company. That's quite meaningful. Most would be pleased to see the board is investing alongside them. You may wish to access this free chart showing recent trading by insiders.
General Public Ownership
With a 47% ownership, the general public, mostly comprising of individual investors, have some degree of sway over YONEX. This size of ownership, while considerable, may not be enough to change company policy if the decision is not in sync with other large shareholders.
Next Steps:
While it is well worth considering the different groups that own a company, there are other factors that are even more important.
I like to dive deeper into how a company has performed in the past. You can find historic revenue and earnings in this detailed graph.
If you would prefer discover what analysts are predicting in terms of future growth, do not miss this free report on analyst forecasts.
NB: Figures in this article are calculated using data from the last twelve months, which refer to the 12-month period ending on the last date of the month the financial statement is dated. This may not be consistent with full year annual report figures.
Have feedback on this article? Concerned about the content? Get in touch with us directly. Alternatively, email editorial-team (at) simplywallst.com.
This article by Simply Wall St is general in nature. We provide commentary based on historical data and analyst forecasts only using an unbiased methodology and our articles are not intended to be financial advice. It does not constitute a recommendation to buy or sell any stock, and does not take account of your objectives, or your financial situation. We aim to bring you long-term focused analysis driven by fundamental data. Note that our analysis may not factor in the latest price-sensitive company announcements or qualitative material. Simply Wall St has no position in any stocks mentioned.