
- PREMIUM
- LIVE QUOTES
- INSTITUTIONS
 Index Options
 State Street
 CME Group
 Nasdaq
 Cboe
Cboe TradingView
 Wall Street Journal
Great week for Liquidia Corporation (NASDAQ:LQDA) institutional investors after losing 1.5% over the previous year
Key Insights
- Given the large stake in the stock by institutions, Liquidia's stock price might be vulnerable to their trading decisions
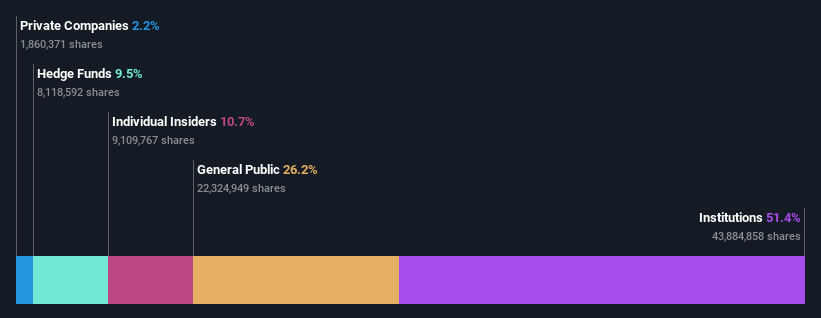
- A total of 14 investors have a majority stake in the company with 52% ownership
- Insiders own 11% of Liquidia
If you want to know who really controls Liquidia Corporation (NASDAQ:LQDA), then you'll have to look at the makeup of its share registry. We can see that institutions own the lion's share in the company with 51% ownership. That is, the group stands to benefit the most if the stock rises (or lose the most if there is a downturn).
Last week's US$89m market cap gain would probably be appreciated by institutional investors, especially after a year of 1.5% losses.
Let's take a closer look to see what the different types of shareholders can tell us about Liquidia.
See our latest analysis for Liquidia
What Does The Institutional Ownership Tell Us About Liquidia?
Many institutions measure their performance against an index that approximates the local market. So they usually pay more attention to companies that are included in major indices.
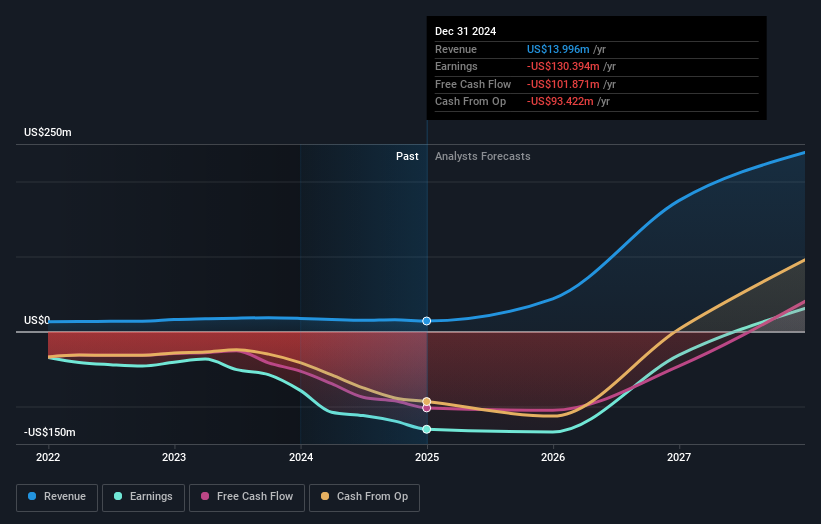
We can see that Liquidia does have institutional investors; and they hold a good portion of the company's stock. This can indicate that the company has a certain degree of credibility in the investment community. However, it is best to be wary of relying on the supposed validation that comes with institutional investors. They too, get it wrong sometimes. It is not uncommon to see a big share price drop if two large institutional investors try to sell out of a stock at the same time. So it is worth checking the past earnings trajectory of Liquidia, (below). Of course, keep in mind that there are other factors to consider, too.
Institutional investors own over 50% of the company, so together than can probably strongly influence board decisions. It would appear that 9.5% of Liquidia shares are controlled by hedge funds. That catches my attention because hedge funds sometimes try to influence management, or bring about changes that will create near term value for shareholders. Our data shows that Caligan Partners, LP is the largest shareholder with 9.5% of shares outstanding. Paul Manning is the second largest shareholder owning 7.2% of common stock, and BlackRock, Inc. holds about 5.5% of the company stock. In addition, we found that Roger Jeffs, the CEO has 2.4% of the shares allocated to their name.
Looking at the shareholder registry, we can see that 52% of the ownership is controlled by the top 14 shareholders, meaning that no single shareholder has a majority interest in the ownership.
While it makes sense to study institutional ownership data for a company, it also makes sense to study analyst sentiments to know which way the wind is blowing. Quite a few analysts cover the stock, so you could look into forecast growth quite easily.
Insider Ownership Of Liquidia
The definition of company insiders can be subjective and does vary between jurisdictions. Our data reflects individual insiders, capturing board members at the very least. Management ultimately answers to the board. However, it is not uncommon for managers to be executive board members, especially if they are a founder or the CEO.
Most consider insider ownership a positive because it can indicate the board is well aligned with other shareholders. However, on some occasions too much power is concentrated within this group.
Our information suggests that insiders maintain a significant holding in Liquidia Corporation. Insiders own US$123m worth of shares in the US$1.1b company. That's quite meaningful. Most would say this shows a good degree of alignment with shareholders, especially in a company of this size. You can click here to see if those insiders have been buying or selling.
General Public Ownership
The general public, who are usually individual investors, hold a 26% stake in Liquidia. While this size of ownership may not be enough to sway a policy decision in their favour, they can still make a collective impact on company policies.
Next Steps:
While it is well worth considering the different groups that own a company, there are other factors that are even more important.
I like to dive deeper into how a company has performed in the past. You can access this interactive graph of past earnings, revenue and cash flow, for free.
But ultimately it is the future, not the past, that will determine how well the owners of this business will do. Therefore we think it advisable to take a look at this free report showing whether analysts are predicting a brighter future.
NB: Figures in this article are calculated using data from the last twelve months, which refer to the 12-month period ending on the last date of the month the financial statement is dated. This may not be consistent with full year annual report figures.
Have feedback on this article? Concerned about the content? Get in touch with us directly. Alternatively, email editorial-team (at) simplywallst.com.
This article by Simply Wall St is general in nature. We provide commentary based on historical data and analyst forecasts only using an unbiased methodology and our articles are not intended to be financial advice. It does not constitute a recommendation to buy or sell any stock, and does not take account of your objectives, or your financial situation. We aim to bring you long-term focused analysis driven by fundamental data. Note that our analysis may not factor in the latest price-sensitive company announcements or qualitative material. Simply Wall St has no position in any stocks mentioned.