
- PREMIUM
- LIVE QUOTES
- INSTITUTIONS
 Index Options
 State Street
 CME Group
 Nasdaq
 Cboe
Cboe TradingView
 Wall Street Journal
NAVER Corporation (KRX:035420) surges 4.8%; individual investors who own 55% shares profited along with institutions
Key Insights
- Significant control over NAVER by individual investors implies that the general public has more power to influence management and governance-related decisions
- A total of 25 investors have a majority stake in the company with 39% ownership
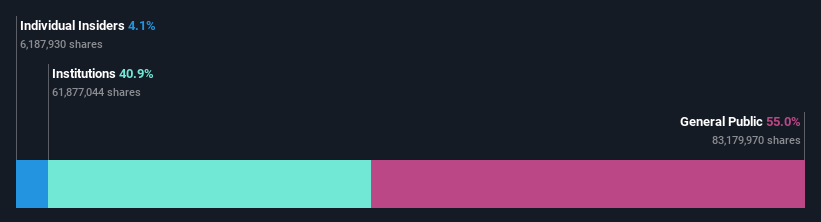
- 41% of NAVER is held by Institutions
Every investor in NAVER Corporation (KRX:035420) should be aware of the most powerful shareholder groups. And the group that holds the biggest piece of the pie are individual investors with 55% ownership. That is, the group stands to benefit the most if the stock rises (or lose the most if there is a downturn).
Following a 4.8% increase in the stock price last week, individual investors profited the most, but institutions who own 41% stock also stood to gain from the increase.
Let's take a closer look to see what the different types of shareholders can tell us about NAVER.
Check out our latest analysis for NAVER
What Does The Institutional Ownership Tell Us About NAVER?
Institutional investors commonly compare their own returns to the returns of a commonly followed index. So they generally do consider buying larger companies that are included in the relevant benchmark index.
We can see that NAVER does have institutional investors; and they hold a good portion of the company's stock. This suggests some credibility amongst professional investors. But we can't rely on that fact alone since institutions make bad investments sometimes, just like everyone does. It is not uncommon to see a big share price drop if two large institutional investors try to sell out of a stock at the same time. So it is worth checking the past earnings trajectory of NAVER, (below). Of course, keep in mind that there are other factors to consider, too.

We note that hedge funds don't have a meaningful investment in NAVER. National Pension Service is currently the company's largest shareholder with 8.8% of shares outstanding. In comparison, the second and third largest shareholders hold about 6.3% and 4.1% of the stock.
Our studies suggest that the top 25 shareholders collectively control less than half of the company's shares, meaning that the company's shares are widely disseminated and there is no dominant shareholder.
While it makes sense to study institutional ownership data for a company, it also makes sense to study analyst sentiments to know which way the wind is blowing. There are a reasonable number of analysts covering the stock, so it might be useful to find out their aggregate view on the future.
Insider Ownership Of NAVER
While the precise definition of an insider can be subjective, almost everyone considers board members to be insiders. Management ultimately answers to the board. However, it is not uncommon for managers to be executive board members, especially if they are a founder or the CEO.
I generally consider insider ownership to be a good thing. However, on some occasions it makes it more difficult for other shareholders to hold the board accountable for decisions.
We can see that insiders own shares in NAVER Corporation. It is a very large company, and board members collectively own ₩1.4t worth of shares (at current prices). Most would say this shows a good alignment of interests between shareholders and the board. Still, it might be worth checking if those insiders have been selling.
General Public Ownership
The general public, mostly comprising of individual investors, collectively holds 55% of NAVER shares. This level of ownership gives investors from the wider public some power to sway key policy decisions such as board composition, executive compensation, and the dividend payout ratio.
Next Steps:
It's always worth thinking about the different groups who own shares in a company. But to understand NAVER better, we need to consider many other factors.
I like to dive deeper into how a company has performed in the past. You can find historic revenue and earnings in this detailed graph.
If you would prefer discover what analysts are predicting in terms of future growth, do not miss this free report on analyst forecasts.
NB: Figures in this article are calculated using data from the last twelve months, which refer to the 12-month period ending on the last date of the month the financial statement is dated. This may not be consistent with full year annual report figures.
Have feedback on this article? Concerned about the content? Get in touch with us directly. Alternatively, email editorial-team (at) simplywallst.com.
This article by Simply Wall St is general in nature. We provide commentary based on historical data and analyst forecasts only using an unbiased methodology and our articles are not intended to be financial advice. It does not constitute a recommendation to buy or sell any stock, and does not take account of your objectives, or your financial situation. We aim to bring you long-term focused analysis driven by fundamental data. Note that our analysis may not factor in the latest price-sensitive company announcements or qualitative material. Simply Wall St has no position in any stocks mentioned.