Shareholders in Melrose Industries (LON:MRO) have lost 1.4%, as stock drops 4.8% this past week
Ideally, your overall portfolio should beat the market average. But the main game is to find enough winners to more than offset the losers At this point some shareholders may be questioning their investment in Melrose Industries PLC (LON:MRO), since the last five years saw the share price fall 40%. Shareholders have had an even rougher run lately, with the share price down 27% in the last 90 days.
If the past week is anything to go by, investor sentiment for Melrose Industries isn't positive, so let's see if there's a mismatch between fundamentals and the share price.
See our latest analysis for Melrose Industries
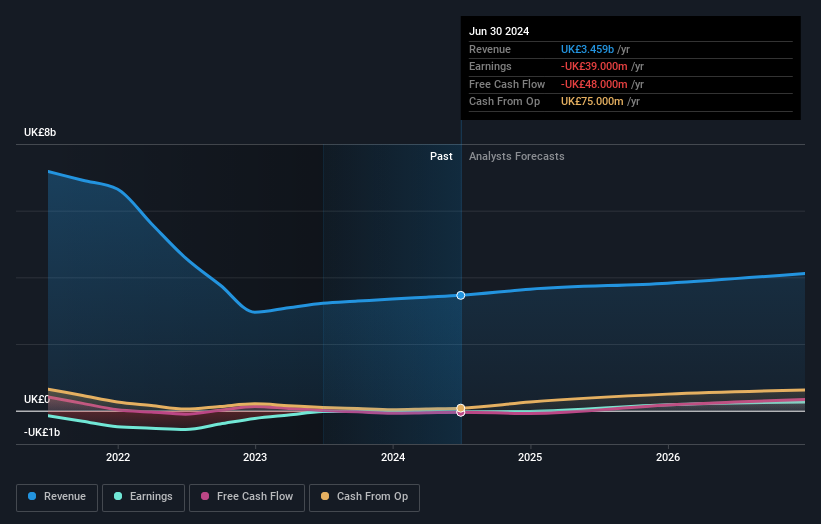
Melrose Industries wasn't profitable in the last twelve months, it is unlikely we'll see a strong correlation between its share price and its earnings per share (EPS). Arguably revenue is our next best option. When a company doesn't make profits, we'd generally hope to see good revenue growth. That's because fast revenue growth can be easily extrapolated to forecast profits, often of considerable size.
Over half a decade Melrose Industries reduced its trailing twelve month revenue by 28% for each year. That puts it in an unattractive cohort, to put it mildly. It seems pretty reasonable to us that the share price dipped 7% per year in that time. This loss means the stock shareholders are probably pretty annoyed. Risk averse investors probably wouldn't like this one much.
You can see how earnings and revenue have changed over time in the image below (click on the chart to see the exact values).

It's probably worth noting that the CEO is paid less than the median at similar sized companies. It's always worth keeping an eye on CEO pay, but a more important question is whether the company will grow earnings throughout the years. You can see what analysts are predicting for Melrose Industries in this interactive graph of future profit estimates.
What About Dividends?
As well as measuring the share price return, investors should also consider the total shareholder return (TSR). The TSR is a return calculation that accounts for the value of cash dividends (assuming that any dividend received was reinvested) and the calculated value of any discounted capital raisings and spin-offs. It's fair to say that the TSR gives a more complete picture for stocks that pay a dividend. We note that for Melrose Industries the TSR over the last 5 years was -1.4%, which is better than the share price return mentioned above. The dividends paid by the company have thusly boosted the total shareholder return.
A Different Perspective
Investors in Melrose Industries had a tough year, with a total loss of 10% (including dividends), against a market gain of about 12%. However, keep in mind that even the best stocks will sometimes underperform the market over a twelve month period. Unfortunately, last year's performance may indicate unresolved challenges, given that it was worse than the annualised loss of 0.3% over the last half decade. We realise that Baron Rothschild has said investors should "buy when there is blood on the streets", but we caution that investors should first be sure they are buying a high quality business. If you would like to research Melrose Industries in more detail then you might want to take a look at whether insiders have been buying or selling shares in the company.
Of course Melrose Industries may not be the best stock to buy. So you may wish to see this free collection of growth stocks.
Please note, the market returns quoted in this article reflect the market weighted average returns of stocks that currently trade on British exchanges.
Have feedback on this article? Concerned about the content? Get in touch with us directly. Alternatively, email editorial-team (at) simplywallst.com.
This article by Simply Wall St is general in nature. We provide commentary based on historical data and analyst forecasts only using an unbiased methodology and our articles are not intended to be financial advice. It does not constitute a recommendation to buy or sell any stock, and does not take account of your objectives, or your financial situation. We aim to bring you long-term focused analysis driven by fundamental data. Note that our analysis may not factor in the latest price-sensitive company announcements or qualitative material. Simply Wall St has no position in any stocks mentioned.
 Index Options
 CME Group
 Nasdaq
 Cboe
Cboe TradingView
 Wall Street Journal