Johnson & Johnson Preps For Q3 Earnings As MedTech Expands, But Stock Sends Mixed Signals
Johnson & Johnson (NYSE:JNJ) is set to announce its third quarter earnings on Oct. 15 before the market opens. Wall Street is expecting the pharmaceutical and healthcare giant to post earnings per share (EPS) of $2.21 and revenue of $22.16 billion.
But while J&J's numbers are in focus, recent headlines about its MedTech acquisitions and drug trial halts are stealing the spotlight.
MedTech Grows, Drug Trials Stumble
Johnson & Johnson recently completed its acquisition of V-Wave, adding a minimally invasive cardiovascular treatment to its MedTech portfolio. The Ventura Interatrial Shunt is expected to strengthen J&J's position in tackling heart failure, but the acquisition comes with a short-term cost. The company has warned that this move will dilute adjusted EPS by around 24 cents in 2024 and 6 cents in 2025, an update they'll likely address in Tuesday’s earnings report.
On the flip side, the company had to discontinue its Phase 3 SunRISe-2 trial, which was investigating a treatment for muscle-invasive bladder cancer. The trial didn't show superiority over chemoradiation, leading to its early termination, though J&J remains optimistic about the future of its TARIS platform, forecasting a $5 billion potential.
The Charts Are Sending Mixed Signals
Despite some positive news in the MedTech arena, Johnson & Johnson’s stock has had a relatively stagnant year, up just 0.93% year-to-date and only 2.49% over the past year. But in the past six months, the stock has seen a 9.40% rise, reflecting a slow but steady recovery.

Chart created using Benzinga Pro
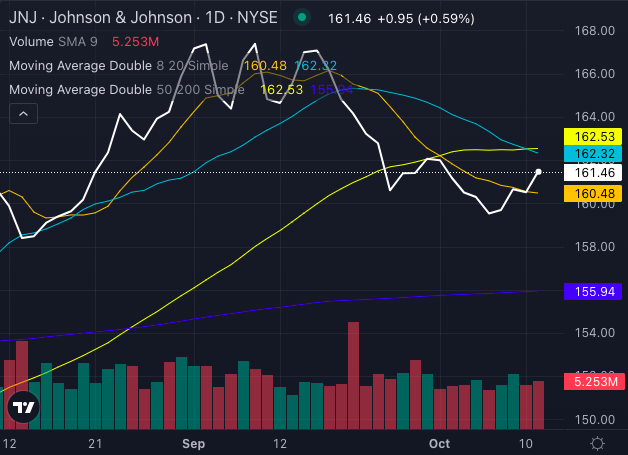
At its current price of $161.46, JNJ stock is just above its eight-day simple moving average of $160.48, a positive sign. However, the stock is lagging behind its 20-day and 50-day simple moving averages, sitting at $162.32 and $162.53, respectively. This signals some underlying selling pressure that may persist in the near term.
Read Also: What Analysts Are Saying About Johnson & Johnson Stock

Chart created using Benzinga Pro
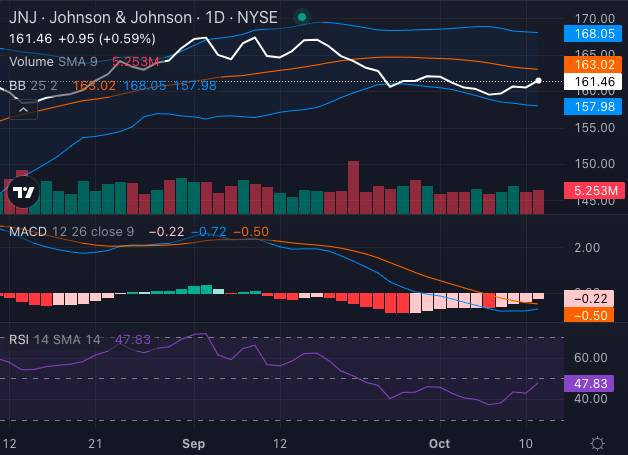
The Moving Average Convergence/Divergence (MACD) indicator at a negative 0.72 leans toward bearishness, hinting at continued downward pressure. Meanwhile, JNJ stock's Relative Strength Index (RSI) of 47.83 suggests the stock is in neutral territory.
The Bollinger Bands show a range between $157.98 and $168.05, with JNJ stock nestled in the lower bearish band. This positioning could suggest that the stock is poised for a bounce, but given the selling pressure, caution is warranted.
Can Q3 Earnings Change The Tune?
All eyes will be on J&J's third-quarter earnings report. Investors are particularly interested in any updates to the company's guidance following the V-Wave acquisition and the ongoing performance of its MedTech and Innovative Medicine segments.
Johnson & Johnson's charts may not be flashing strong bullish signals, but its strategic moves in MedTech and future product pipeline could offer long-term growth potential.
Investors will have to weigh the upcoming earnings report to see if J&J stock can shake off recent pressures and revitalize its performance.
Read Next:
Photo: Shutterstock
 Index Options
 CME Group
 Nasdaq
 Cboe
Cboe TradingView
 Wall Street Journal