ROC Oscillator
What is the ROC oscillator?
The Rate of Change (ROC) oscillator is a momentum oscillator that calculates the change of closing prices over a period of time. It appears in a separate chart below or above the price chart. It is also called the momentum oscillator because it’s the simplest form of momentum oscillators.
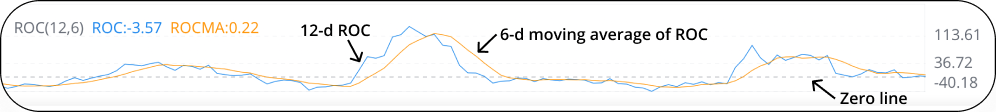
On Webull, you can see three components in the ROC chart: the ROC line, the ROC moving average line, and the zero line. Compared with an ROC line, an ROC moving average line appears smoother and reduces the impact of short-term fluctuations.
The default setting is 12-d ROC and 6-d ROCMA. You can always change the setting according to your needs. If you want to see a longer-term trend, use a longer-term ROC.
*ROC value = (Last closing price – Closing price 12 trading days ago)/Closing price 12 trading days ago*100.
What does the ROC oscillator imply?
The ROC compares the closing price on one day with the closing price n trading days before (12-d is normally the default setting). Generally speaking, if the ROC is positive, the price is increasing. If the ROC is negative, the price is falling. It can be used to identify a trend or short-term overbought or oversold levels.
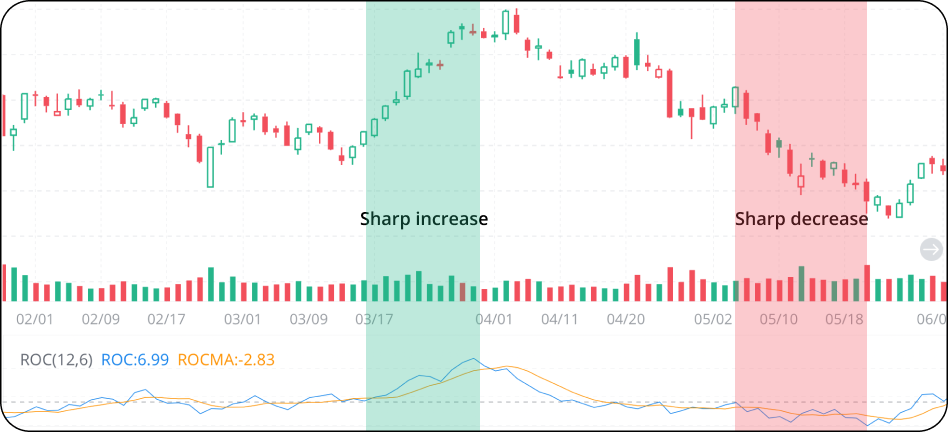
1. An increase in either direction implies increased momentum.
If the ROC increases while staying above the zero line, the upside momentum is strong. If the ROC decreases while staying below the zero line, the downside momentum is strong.
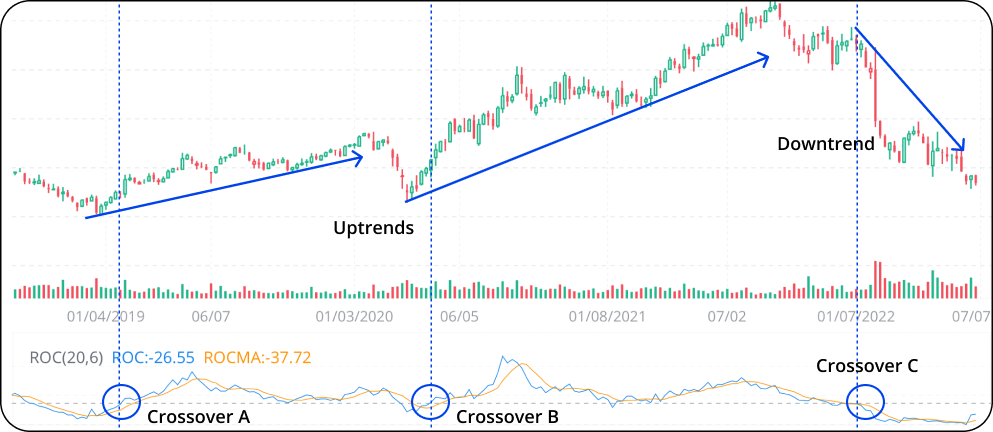
2. In trending periods, the ROC crossing above the zero line is a bullish signal. The ROC crossing below the zero line is a bearish signal.
As we can see below, the ROC crosses above the zero line at point A and stays above the line for about a year. This corresponds to the first uptrend in the picture. Investors may want to buy around crossover A.
After a small and short dip in the negative area, the ROC again climbs above the zero line at point B. The following sharp increase in the ROC value corresponds to the second uptrend. Investors may also want to buy around crossover B.
The ROC made a significant crossover below the zero line at point C. This is followed by a deep drop in value and corresponds to the downtrend in the picture. Investors may want to sell around crossover C.
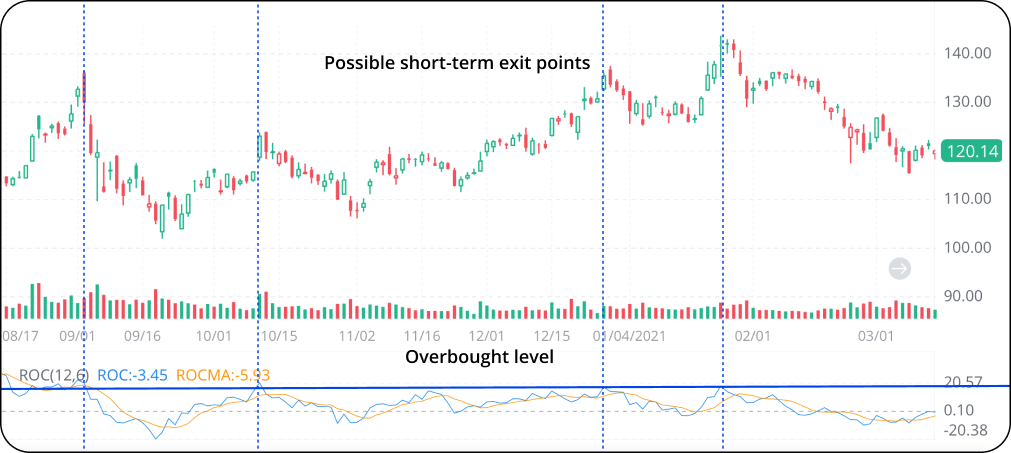
3. Overbought or oversold levels can be identified when the price is generally trending higher or lower.
For example, when the price is constantly making higher highs and higher lows in zigzags, we can find out a possible overbought level by identifying the approximate upper limit of the ROC movements. In the example below, an overbought level is identified at a ROC of about 20. Short-term investors may regard the prices corresponding to the overbought level as exit points.
Get a Heads-Up When Technical Signals Appear
Watching prices can be time-consuming. One simple way to watch a price efficiently is by setting a customized price alert. Check below to see how.

*Finally, please note that technical analysis is not 100% accurate. The interpretation of results is generally subjective.
What's More
-Try it out on paper trading on our latest mobile version
-Take a quiz to test yourself on our latest mobile version