
In U.S. Presidential Election Years, Look to Small-Cap and Value Stocks
Report highlights
- U.S. presidential election outcomes can have varying influences on stock market returns depending on size and style.
- In election years:
Small-cap stocks tend to perform better than large-cap stocks due to higher domestic exposure and lower sensitivity to big policy changes.
Value stocks tend to perform better than growth stocks due to stable cash flow and dividend characteristics.
Large-cap returns before and after presidential elections aren't meaningfully distinct. - Investors seeking to hedge uncertainty can look to historical performances and implied volatility to manage their exposures, utilizing futures and liquid weekly options for more timely implementations.
- CME offers futures listings to capture size and style themes related to U.S. presidential elections.
- As election outcomes unfold, investors can tap into our Equity complex for deep liquidity and around-the-clock trading to make necessary adjustments, especially during non-U.S. hours.
Time marches on
The U.S. presidential election is approaching fast. Elections are an important event risk for global financial markets due to their influence on market returns. In addition to heightened volatility leading into the elections, the president-elect can make big changes to policies related to foreign affairs, trade, the economy, taxes as well as regulations. Therefore, market participants around the world are keeping a keen eye on the elections and are making tactical adjustments.
With both candidates coming in very close in the polls,1 it’s worthwhile examining how markets have typically performed in election years versus non-election years.
S&P 500 returns before and after presidential elections show that they aren't meaningfully distinct from non-election-year returns.2 Since different stocks have different sensitivities to policy changes, it’s important to look beyond the broad market and dive deeper into returns by size and style.
Large vs. small and value vs. growth
The performance spread between large-cap versus small-cap stocks – represented by the return difference between S&P 500 and Russell 2000 as well as the spread between value-versus-growth stocks - represented by the returns difference between Russell 1000 Value Index versus Russell 1000 Growth Index – can provide investors with actionable insights.
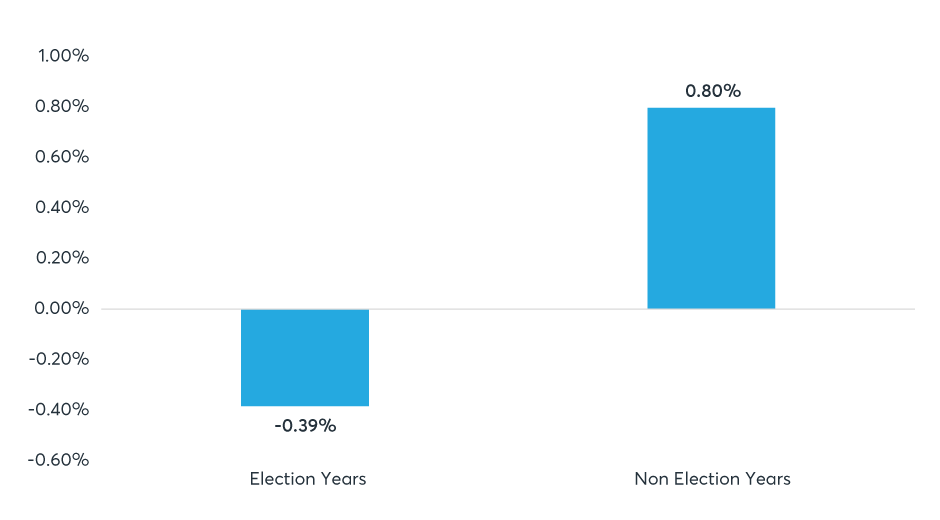
In general, small-cap stocks tend to do better in election years than in non-election years. Average monthly excess returns of large-cap over small-cap stocks are negative in election years, while turning positive in non-election years (see Exhibit 1). A study by S&P Global shows that larger-cap stocks have more foreign revenue exposure than smaller-cap and mid-cap names and are more sensitive to major policy changes.3
Exhibit 1: Average monthly returns - Large cap minus small cap
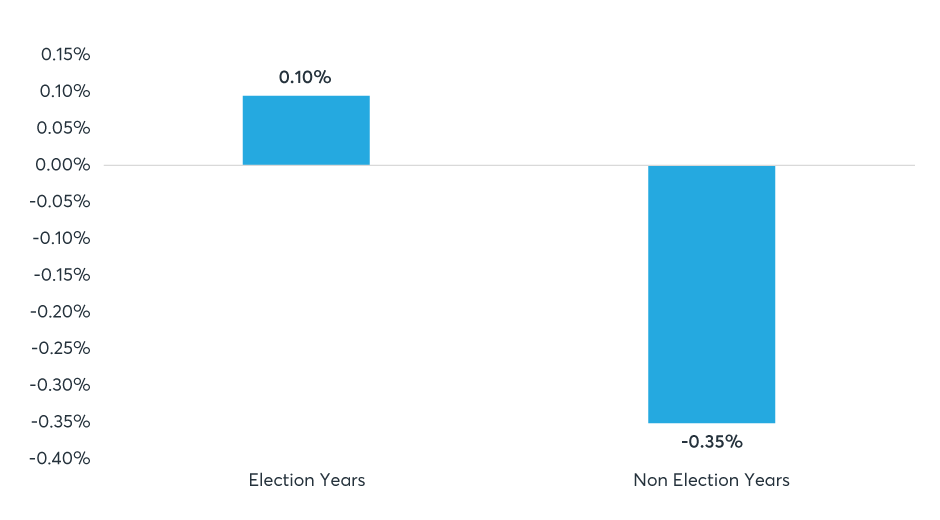
Within style, value stocks tend to perform better during election years, whereas growth stocks tend to do better during non-election years. The average monthly excess returns of value stocks over growth stocks is positive during election years. The opposite is seen in non-election years. Value stocks tend to be mature companies with stable cash flows and dividends, providing a level of protection from sudden policy changes.4
Exhibit 2: Average monthly returns - value minus growth
Manage exposures tactically
Elections always introduce elements of unpredictability and uncertainty. Market participants seeking direction can look to implied volatility and historical performance to determine which type of stocks that are resistant to big policy changes.
As election-related events unfold, investors can use our Equity futures and options complex to implement timely tactical adjustments and manage exposures appropriately. In particular, investors can tap into around-the-clock trading and deep liquidity to implement changes during non-U.S. hours.
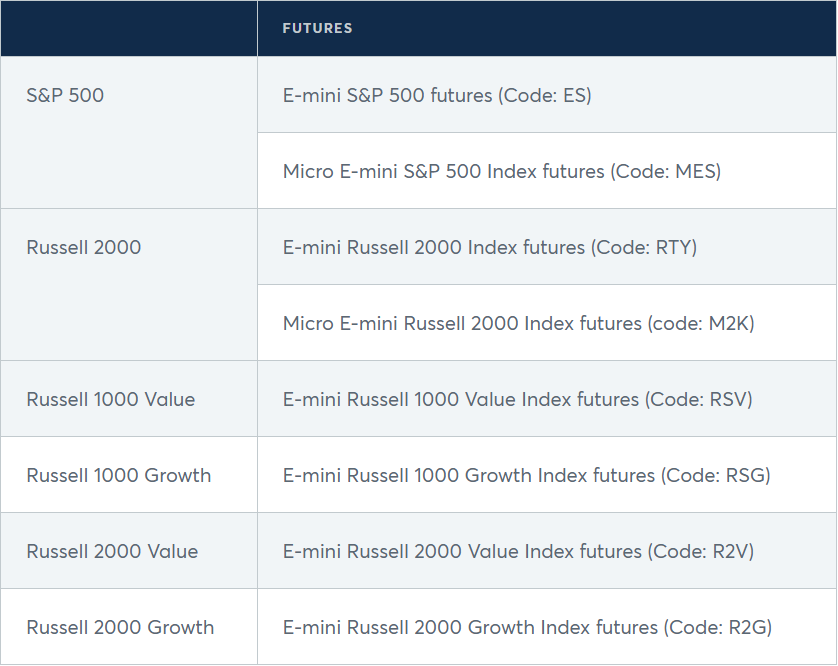
Futures listings available to implement election-related positioning
The following futures listings are available to capture size and style themes related to U.S. presidential elections.
References
1. Polls taken as of October 22, 2024
2. State Street Global Advisors
https://www.ssga.com/us/en/institutional/insights/the-performance-of-us-equities-in-election-years-over-the-last-century
Similarly, CME Group’s analysis observes a small difference in returns during six months leading into presidential election versus non-election years, as well as during six months following the elections.
3. See S&P Dow Jones Indices. “Impact of Global Economy on the S&P 500”. March 2018.
4. Cambiar Investors, Market Insights. https://cambiar.com/election-years-value-vs-growth-2/
All examples in this report are hypothetical interpretations of situations and are used for explanation purposes only. The views in this report reflect solely those of the author and not necessarily those of CME Group or its affiliated institutions. This report and the information herein should not be considered investment advice or the results of actual market experience.