
Advanced Bond Concepts
Credit Spread – "The Extra Yield for Taking on Risk"
A credit spread is the difference in yield between a corporate bond and a risk-free bond (typically a US Treasury) with the same maturity. This spread reflects the additional return investors demand for taking on the risk that the corporate issuer might default.
For example, if a 10-year U.S. Treasury yields 3% and a 10-year corporate bond yields 6%, the credit spread is 3% (or 300 basis points). The wider the spread, the more risk the market perceives in the corporate issuer.
Credit spreads fluctuate with market conditions and can signal changes in credit risk, investor sentiment, or broader economic outlooks. In times of stress, spreads tend to widen as investors seek safety in government bonds. In more stable periods, spreads may narrow as risk appetite increases.
Credit spread analysis helps compare risk-adjusted returns across different bonds, sectors, and economic cycles.
Default Risk – "The Chance You Don’t Get Paid"
Default risk is the probability that a bond issuer will fail to meet its payment obligations, either on interest or principal. It varies widely based on the issuer’s financial health, industry conditions, and overall economic climate. It’s also closely tied to credit spreads, in that a higher risk of default, the larger the credit spread.
Investment-grade bonds, such as those rated AAA or AA, typically have very low default risk. U.S. Treasuries, for example, are considered virtually default-free. Lower-rated, high-yield (junk) bonds carry a much higher chance of default, which is why they offer significantly higher yields.
Credit ratings from agencies like Moody’s, S&P, and Fitch help assess default risk. However, these ratings are backward-looking and should be supplemented with current financial analysis and an understanding of the issuer’s industry exposure.
Default risk is a key input in bond pricing and return expectations. Higher yields often signal higher underlying risk.
Recovery Rate – "How Much You Get Back After Default"
Even if a bond issuer defaults, investors often recover some portion of their money through legal proceedings, liquidation, or corporate restructuring. The recovery rate measures what percentage of the bond’s face value is ultimately recovered.
For example, if a company defaults on a $1,000 bond and bondholders recover $400 through asset liquidation, the recovery rate is 40%. This metric helps investors estimate potential losses in a worst-case scenario.
Historically, recovery rates vary based on a bond’s seniority:
- Senior secured bonds tend to recover 60–80%
- Senior unsecured bonds average around 30–50%
- Subordinated bonds may recover just 10–30%
The lower the recovery rate, the greater the risk of permanent capital loss in default situations.
Horizon Return (Total Return Analysis) – "What You Actually Earn Over Time"
Horizon return is a forward-looking estimate of how much total return you will earn from a bond over a specific investment period. Unlike current yield or yield to maturity, this measure accounts for real-world variables like reinvested coupon payments, interim price changes, and the bond’s price at the end of the holding period.
It’s useful when you don’t plan to hold the bond to maturity, or when you want to evaluate how different holding periods might affect overall return. However, it can be a difficult estimate because you must make assumptions about what the value of the bond will be at a future date.
For example, if you buy a 5-year bond with a 4% coupon and plan to hold it for 3 years, your horizon return will include:
- Interest earned from coupon payments
- Any capital gain or loss based on the bond’s price change during your holding period
- Interest earned from reinvested coupons
Horizon return is an important tool for portfolio strategy, helping investors forecast return outcomes under different scenarios.
Pull-to-Par Effect – "Why Bond Prices Move Toward Face Value"
As a bond approaches its maturity date, its market price naturally moves toward its par value (typically $1,000 per bond). This phenomenon, known as the pull-to-par effect, occurs because the bond’s remaining time to maturity shortens and investors grow more certain about receiving full repayment.
For instance, a bond trading at $950 will gradually rise to $1,000 as it nears maturity, assuming no default. A bond trading at $1,050 will steadily decline toward $1,000. This happens because the discount or premium becomes less meaningful as the bond’s maturity approaches.
Understanding pull-to-par is essential for timing purchases and sales, especially if you're trading bonds before maturity or managing price expectations in shorter time frames.
Quick Summary Table
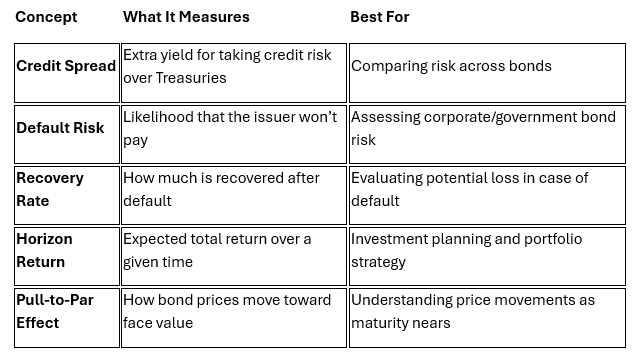
Bottom Line
Advanced bond concepts allow investors to move beyond coupon rates and maturity dates to better assess risk, price behavior, and performance forecasting. Each of these measures plays a role in balancing risk, return, and timing across a fixed income portfolio.
- Use credit spreads to compare corporate bonds against safer benchmarks like Treasuries.
- Rely on default risk and recovery rate to measure potential downside.
- Apply horizon return to evaluate investment outcomes over specific timeframes.
- Keep pull-to-par in mind when analyzing price behavior as a bond approaches maturity.
These tools deepen your understanding of the fixed-income market and help you make more informed, confident decisions as a bond investor. For more advanced insights and strategy, explore Webull Learn.