
What to Look for During Earnings Season

Why is earnings season important?
The price of a stock reflects market sentiment. A bullish expectation for the stock pushes the price higher while a bearish expectation brings the price down. Ultimately, these sentiments are determined by earnings. That’s why all investors, no matter their short- or long-term investment goals, pay attention to earnings report.
Earnings season is the time of year when most public companies publish their financial reports. These reports provide investors with important information about the company's financial performance and prospects, and thus have a significant impact on the company's stock price. The stock market as a whole may also be affected by the overall performance of various companies during earnings season. (Click here to see the earnings calendar on the latest Webull App)
Among the many numbers in the financial report that tell us about how the company is performing, two numbers stand out in particular—EPS and revenue.
EPS
EPS, or earnings per share, is a measure of a company's profitability per share. It is calculated by dividing the company's net income by the number of shares outstanding. Put simply, it measures how much profit the company has generated over the quarter for each common share it issued.
There are two ways to evaluate the EPS:
1. Compare actual EPS with the expectation.
Analysts give estimations on how the earnings may look before the earnings season starts, and their estimations are already impacting the market. If the actual EPS beats analysts’ expectations, it’s likely to stimulate investors’ confidence and bring the stock price up. On the contrary, if the EPS does not meet expectations, it may bring the stock price down.
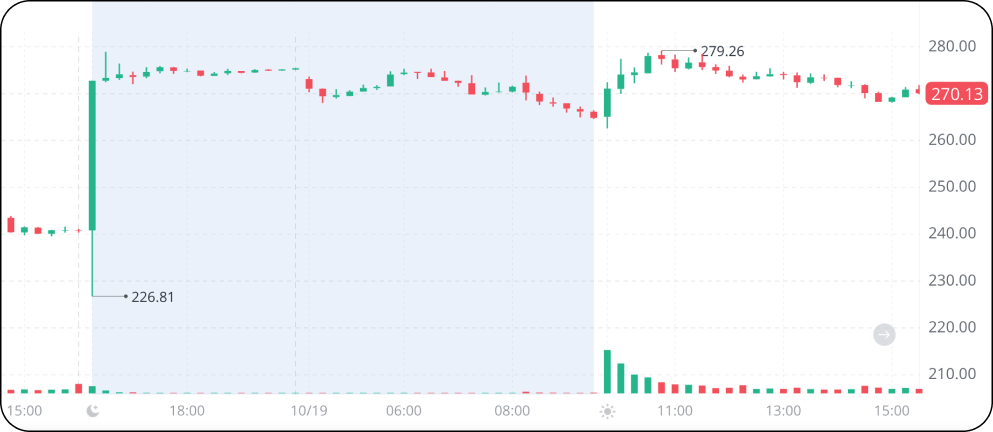
The 15-minute chart below shows how a better-than-expected EPS could affect a stock price. When the company reported an EPS of $3.10, beating the estimate of $2.13 after market close on October 18th, its price surged more than 10%, forming a gap on the chart.
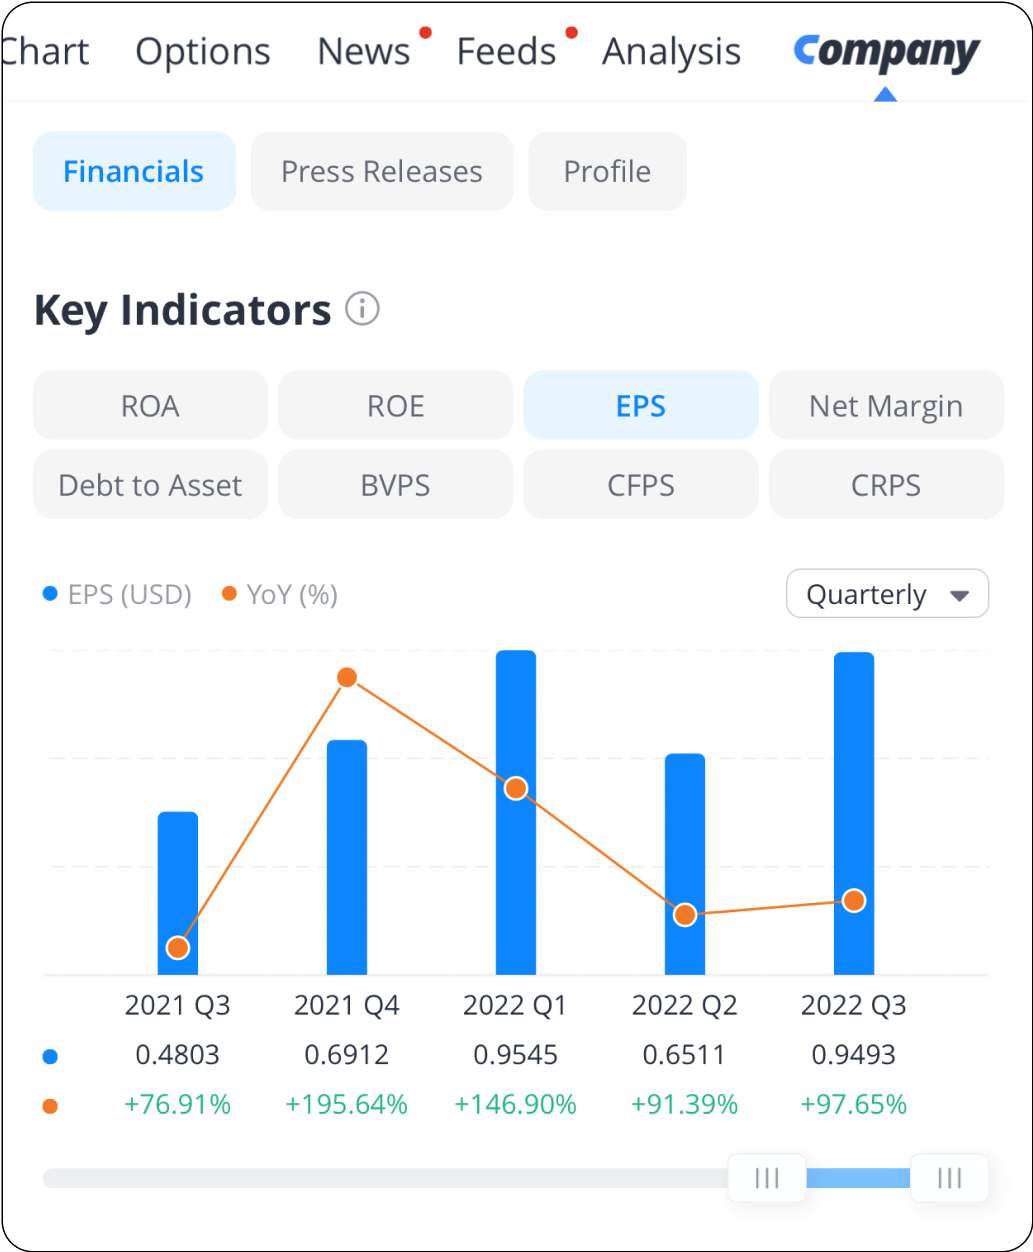
2. Compare actual EPS with previous EPS.
Investors can evaluate the growth momentum and potential of the company by comparing its EPS with previous ones. Specifically, they may look at quarterly and yearly EPS growth rates. If the growth rate is strong, the stock price is likely to climb.
Revenue
Revenue shows the total income a company generated in the last quarter. It’s what keeps a company alive. It cannot be used to compare the profitability of different companies, but it’s the primary driver of profitability.
Investors can evaluate the revenue release in two ways:
1. Compare actual revenue with expectation. If the actual revenue beats analysts’ expectations, it’s likely that the stock price will go up. On the contrary, if the revenue does not meet expectations, the stock price may go down.
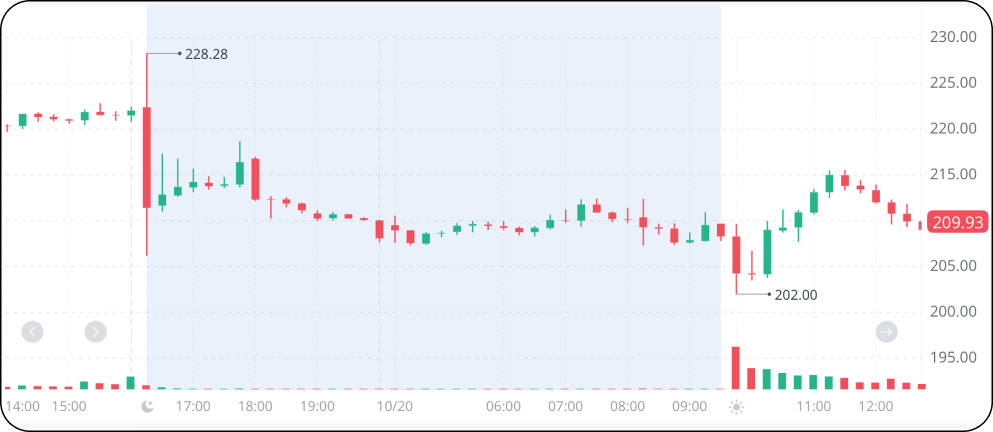
The 15-minute chart below illustrates how the market would react to a disappointing revenue. The company released its earnings report after market close on October 19th, reporting a revenue of $21.45 billion, falling short of the analyst estimate of $21.96. Its share price slumped by more than 5% immediately.
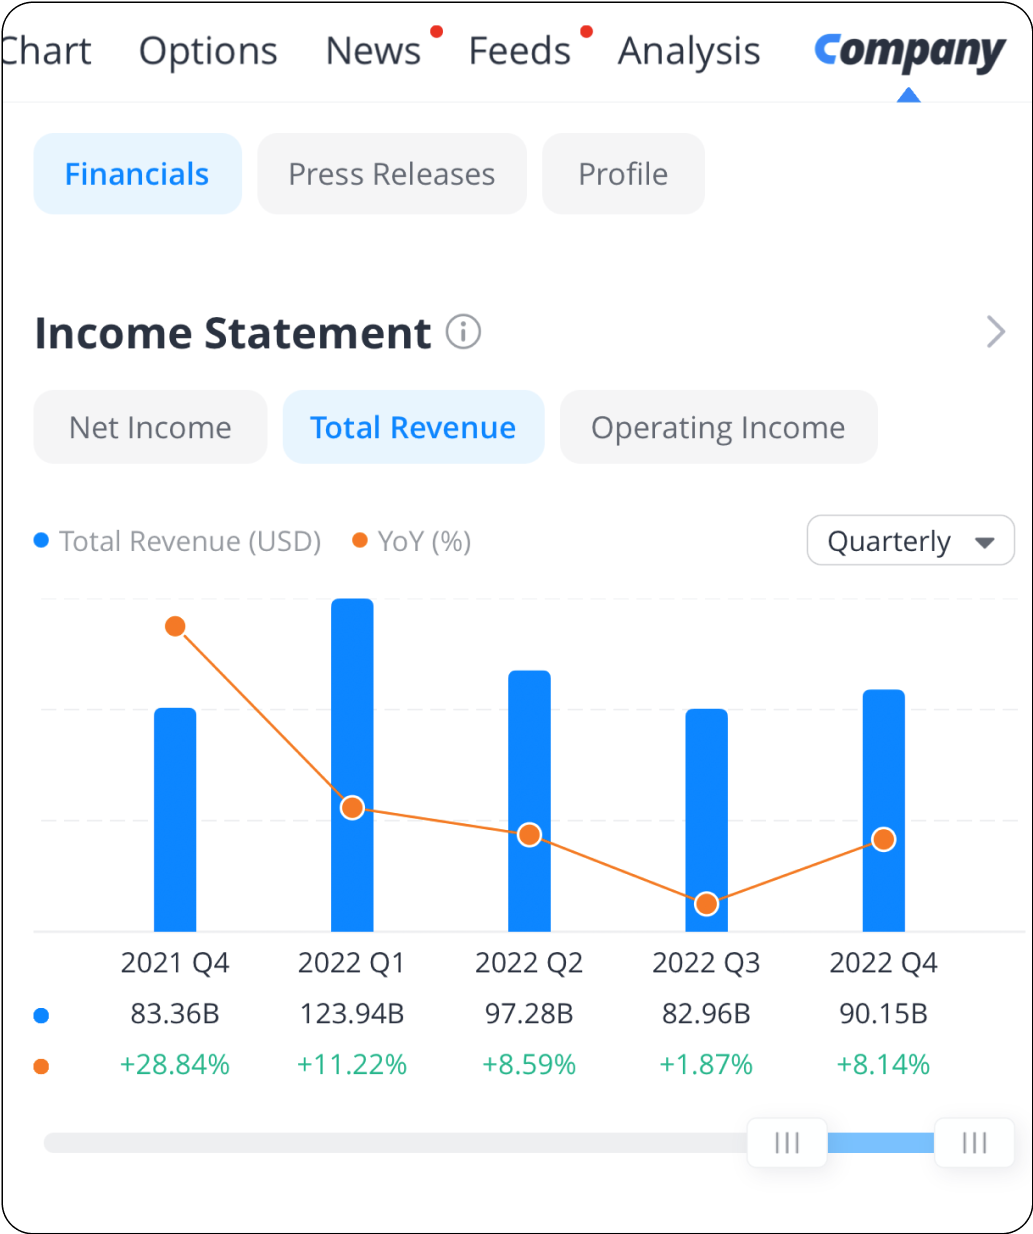
2. Compare actual revenue with previous numbers. Investors can look at the revenue over different quarters to see if a company has steadily growing revenue. A sudden decrease in revenue may indicate risks, while a robust revenue increase may indicate high growth potential.
Apart from the total revenue, the revenue from each of the major business segments is also included in the financial statements. Investors can check the revenue among different segments to predict the future potential of a company or risks it may pose.
The bottom line
There are many metrics in an earnings report that can help investors evaluate a company. Revenue and EPS are the most straightforward of these metrics and have the biggest impact on the market. Investors must be aware of the earnings reports to prepare for potential market movements.