
Diagonal Spreads
A diagonal spread is a complex options strategy that combines the features of a vertical and horizontal spread. This creates a two-legged strategy with two options of different strike prices and expirations. The option chain shown below depicts a diagonal call spread, with the orange circle around the short call, and the blue circle around the long call.
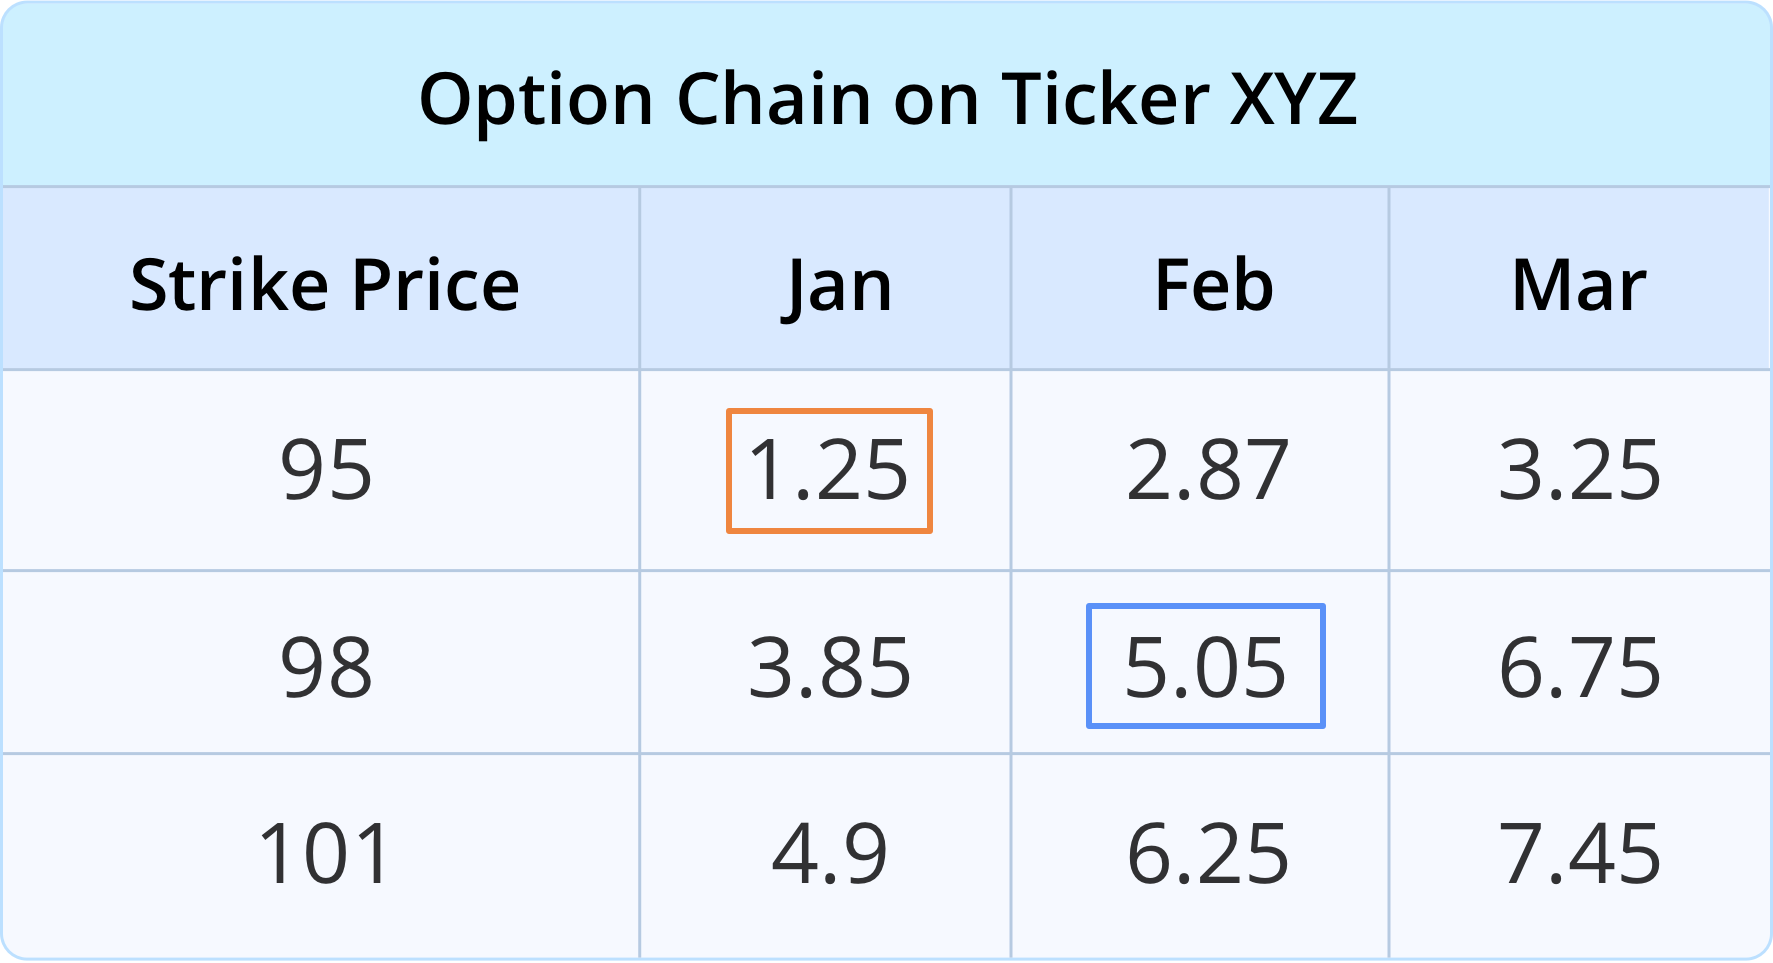
The legs of the spread are separated vertically by strike price and horizontally by expiration date. If you were to draw a line between the two legs in the option chain it would be diagonal, hence the name “diagonal spread.”
Because of the different expiration dates, diagonal spreads are versatile. After the near -term option expires, investors can choose from several different strategies to remain in a trade. In addition to the added flexibility, diagonal spreads can reduce the overall cost of a trade and even earn a net credit by collecting premiums. However, the potential risks include losing the entire principal or even possibly more. As with all spread strategies, diagonals are an especially complex strategy, with lots of moving parts. You should research carefully before trying this strategy, and make sure it’s the right one for your risk tolerance and investment goals.

Long Diagonal Bear Call Spread
A long diagonal bear call spread is generally set up by selling an out-of-the-money near-term call and buying a higher strike call with a later expiration date. The credit earned by selling the near-term call option offsets the debit paid to buy the long call option.
Ideally, you want the underlying price to remain just below the strike price of the short call option, allowing you to keep the full premium when the option expires. Time decay will impact the near-term option more than the longer-term option, so as time passes the short leg will lose its value more quickly than the long leg. Increases in implied volatility can boost the price of the long call, so by the time the short call option expires, the long option may still hold a significant amount of its extrinsic value.
When the near-dated short call option expires there are several choices you can make depending on your outlook:
- Sell a short call option to create another diagonal spread
- Sell a short call option to create a vertical spread
- Sell a short call option to create a calendar spread
- Continue to hold the long call
- Sell the long call
An additional credit can be earned by selling another short call option (Choices 1-3). By selling an additional short call, you can possibly generate a net credit on the trade. The further apart the expiration dates of the long and short legs, the more times this maneuver can potentially be executed.
However, if your outlook on the underlying turns bullish, you can continue to hold the long call option (Choice 4). Lastly, you can choose to close out the long call option (Choice 5) to recoup what remains of its value.
Theoretical Pay-Off Chart of a Long Diagonal Bear Call Spread
Pictured below are two different graphs of a diagonal bear call spread, one which opens the position with a credit, and one with a debit. Whether there is a credit or debit at opening is determined by two factors: the width of the spread between the strike prices and the time until expiration for the two contracts. A narrower spread usually results in a lower credit or even a debit, as the long option is closer to the money and more expensive to open. For the same reason, the time until expiration of the contracts also affects whether a credit or debit is established. The more time there is left until expiration on the long option, the more expensive it is to open that leg of the position, resulting in a lower credit or possibly a debit.
Here is a graph of the diagonal bear call spread pay-off when a credit is established upon opening.
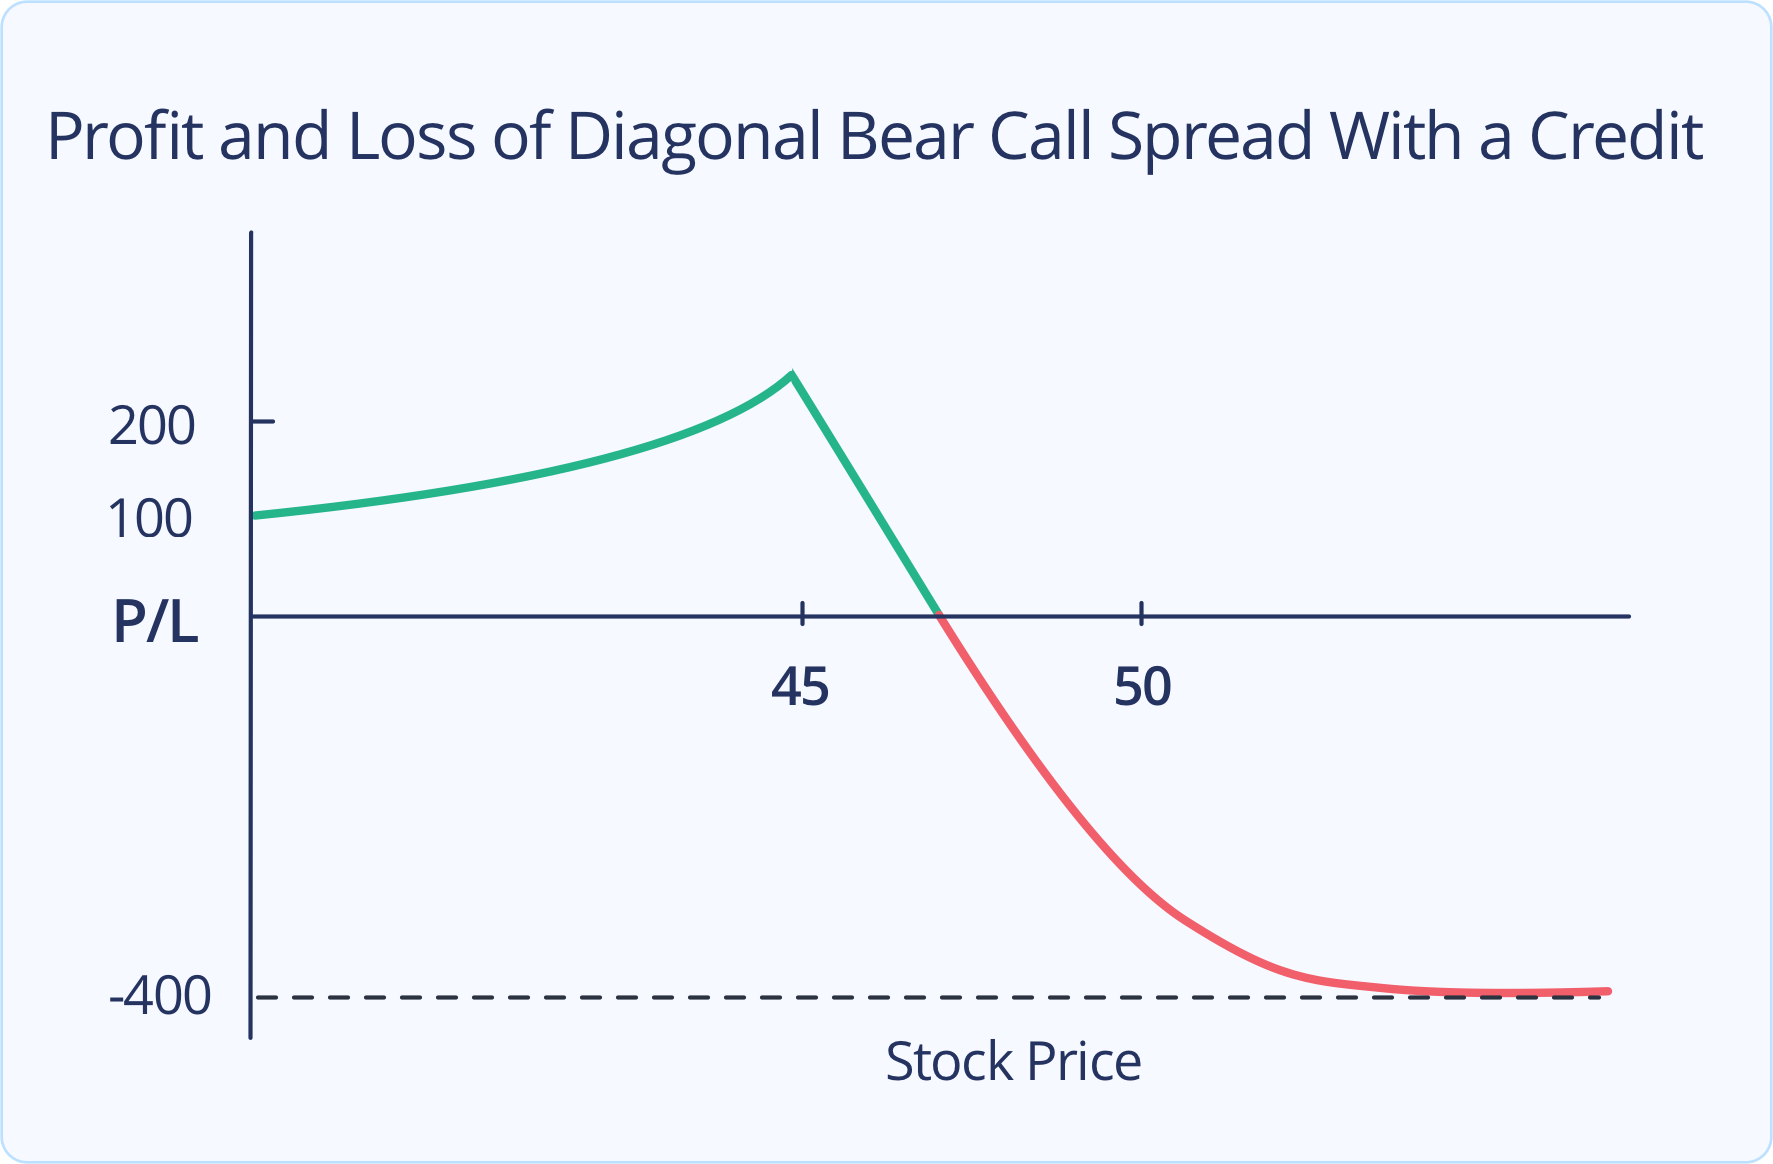
This graph depicts the theoretical profit and loss of the strategy at the expiration of the near-term short call option. The short option has a strike price of $45 and the long option has a strike price of $50. At the time this position is opened, a $100 credit is received as the short option has considerably more value than the long option. As the price of the underlying rises to just under the $45 strike price of the short option, the total profit of the strategy reaches its peak. This is due to the long option, which gradually increases in value as it gets closer to being in the money. The max loss occurs when the underlying considerably exceeds the strike price of both the short and long option. The max loss is equal to the width of the spread minus the opening credit. In this case, the max loss is $400—the width of the spread times the standard share multiplier ($5 spread x 100 shares = $500), minus the initial $100 credit. Note, the reason why the plot of the graph is curved is due to the time value of the open long call option.
The graph below shows a diagonal bear call spread which was opened at a net debit.
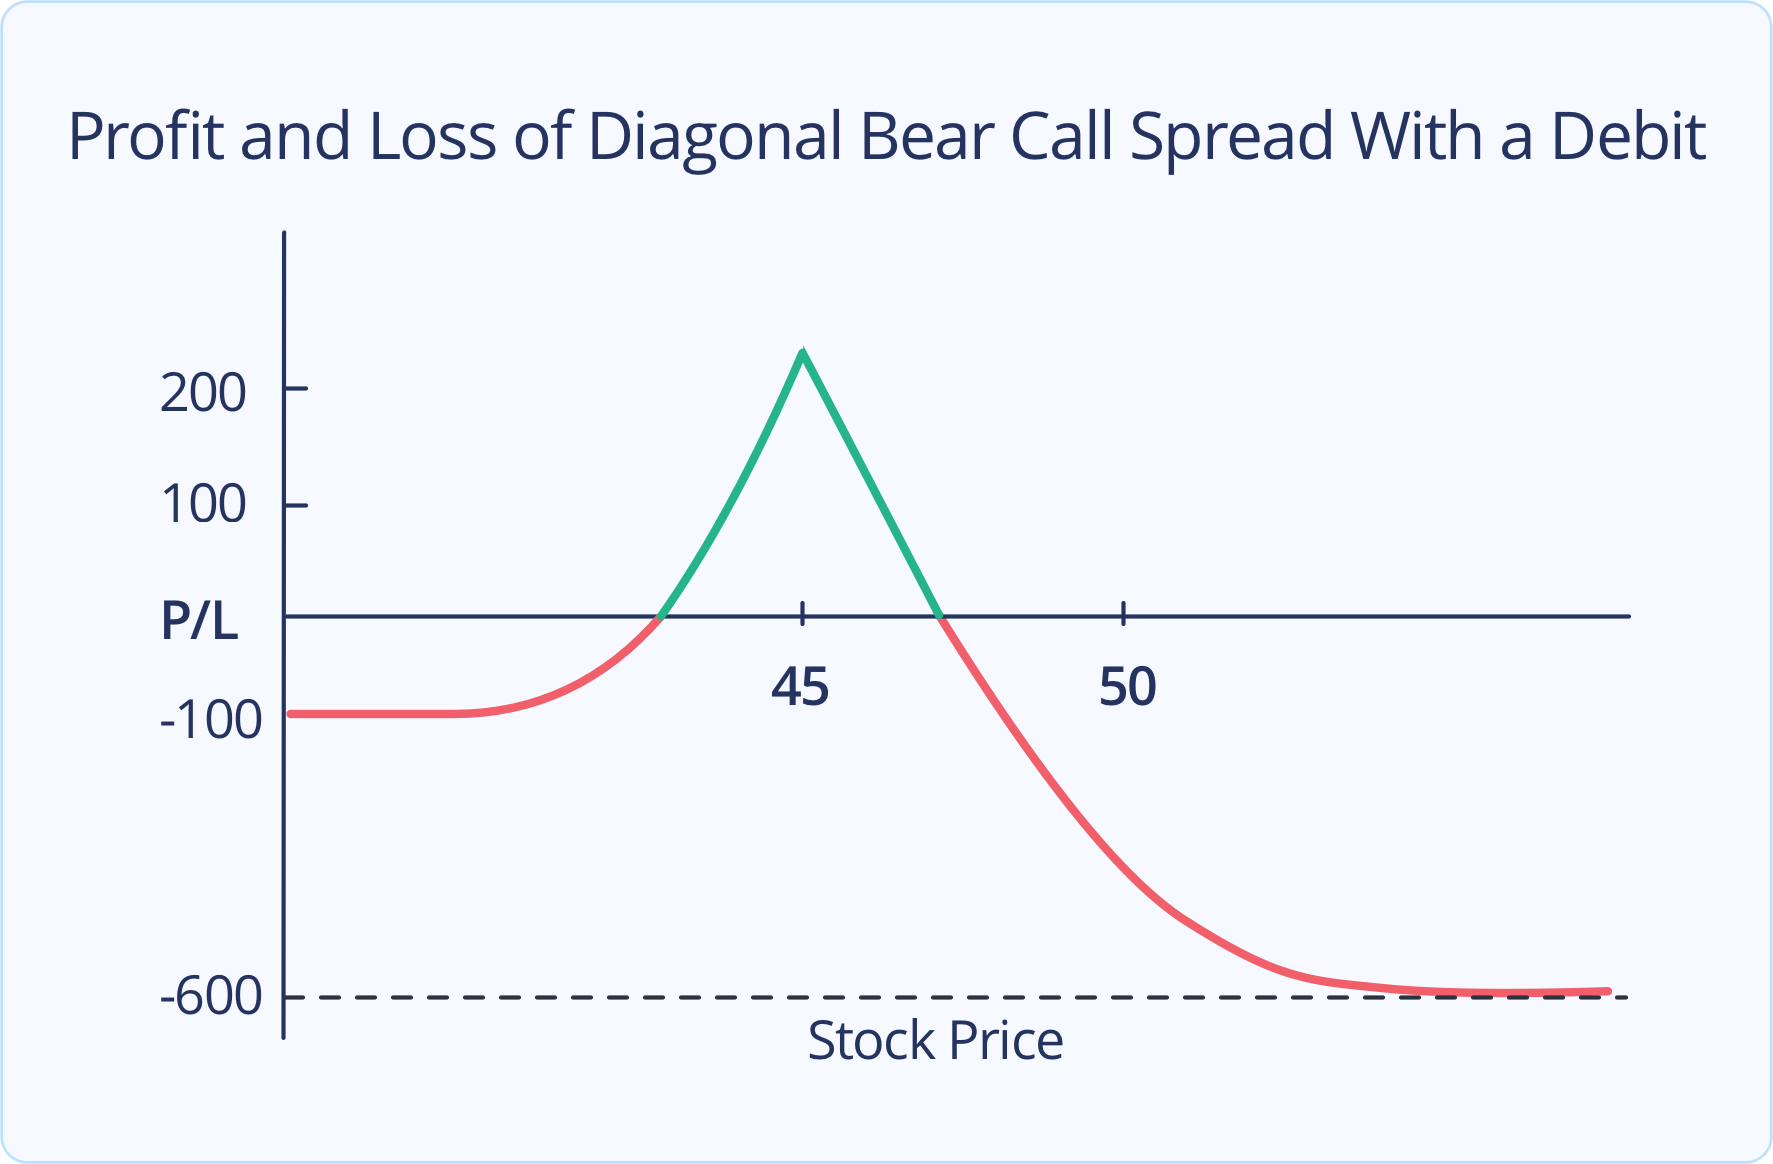
The graph depicts the profit and loss of the strategy at the expiration of the front-end call option. Like the previous example, the short call has a strike price of $45 and the long call has a strike price of $50. But in this case, the position is opened with a debit instead of a credit. Again, the max profit of the position occurs when the underlying sits just below the strike price of the short call at expiration. In this particular example, at this point, the time value of the long call option exceeds the cost of the net debit. This is because the long call option increases in price as it moves closer to the money. The max loss of this strategy occurs when the underlying considerably exceeds the strike price of both the short and long option. The max loss is equal to the width of the spread between the two strike prices, plus the net debit. In this example the max loss is $600—the width of the spread times the standard share multiplier ($5 x 100 shares = $500), plus the initial $100 debit, a total loss of $600.
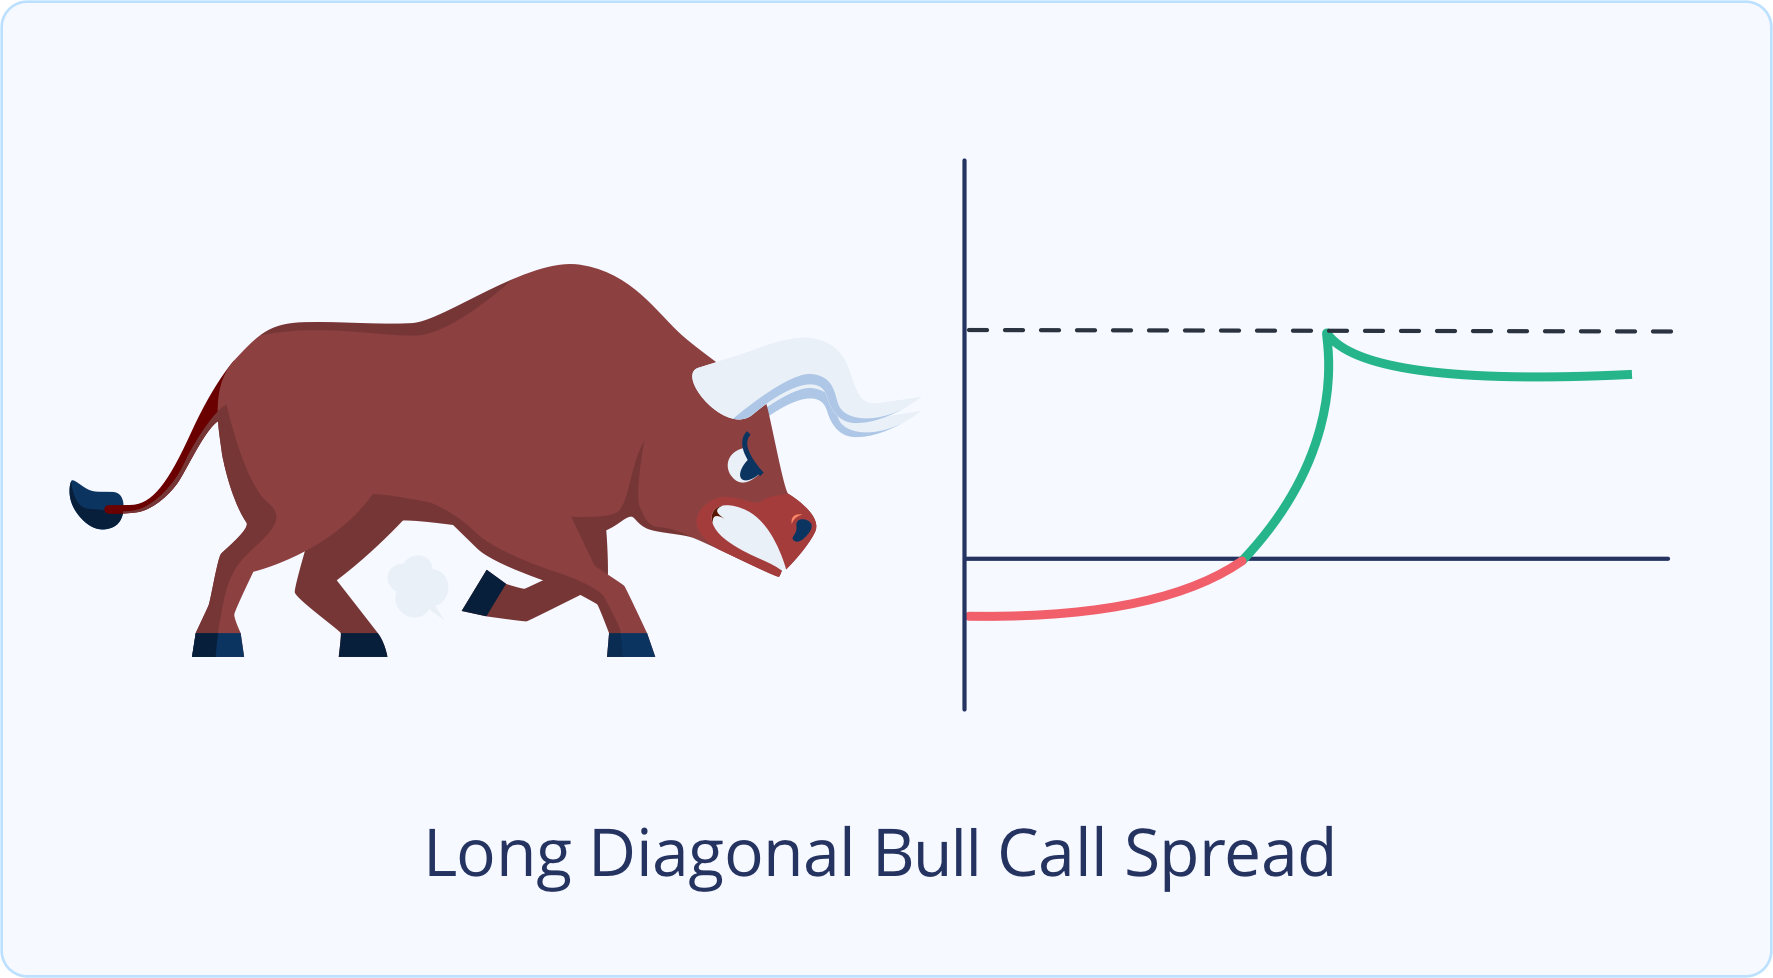
Long Diagonal Bull Call Spread
A long diagonal bull call spread is constructed by buying an out-of-the-money call and selling a further out-of-the-money call with a shorter-term expiration date. The credit earned by selling the near-term call option offsets the debit paid to buy the long call option.
Ideally, you want the underlying price to move up to just below the strike price of the short call option, allowing your long call to go into the money and gain value while the short call expires out of the money. Time decay will impact the nearer-term option more than the longer-term option, so as time passes the short leg will lose its value more quickly than the long leg. Also, an increase in implied volatility can boost the price of the long call, so by the time the short call option expires, the long option may retain a significant amount of extrinsic value.
When the near-dated short call option expires there are several choices you can make depending on your outlook:
- Sell a short call option to create another diagonal spread
- Sell a short call option to create a vertical spread
- Sell a short call option to create a calendar spread
- Continue to hold the long call
- Sell the long call
An additional credit can be earned by selling another short call option (Choices 1-3). By selling an additional short call, you can reduce your net debit or even possibly generate a net credit on the trade. The further apart the expiration dates of the long and short legs, the more times this maneuver can potentially be executed.
However, if your outlook on the underlying turns more bullish, you can continue to hold the long call option (Choice 4). Lastly, you can choose to close out the long call option (Choice 5) to recoup what remains of its value.
Theoretical Pay-Off Chart of a Long Diagonal Bull Call Spread
The graph below shows a diagonal bull call spread that was opened at a net debit.
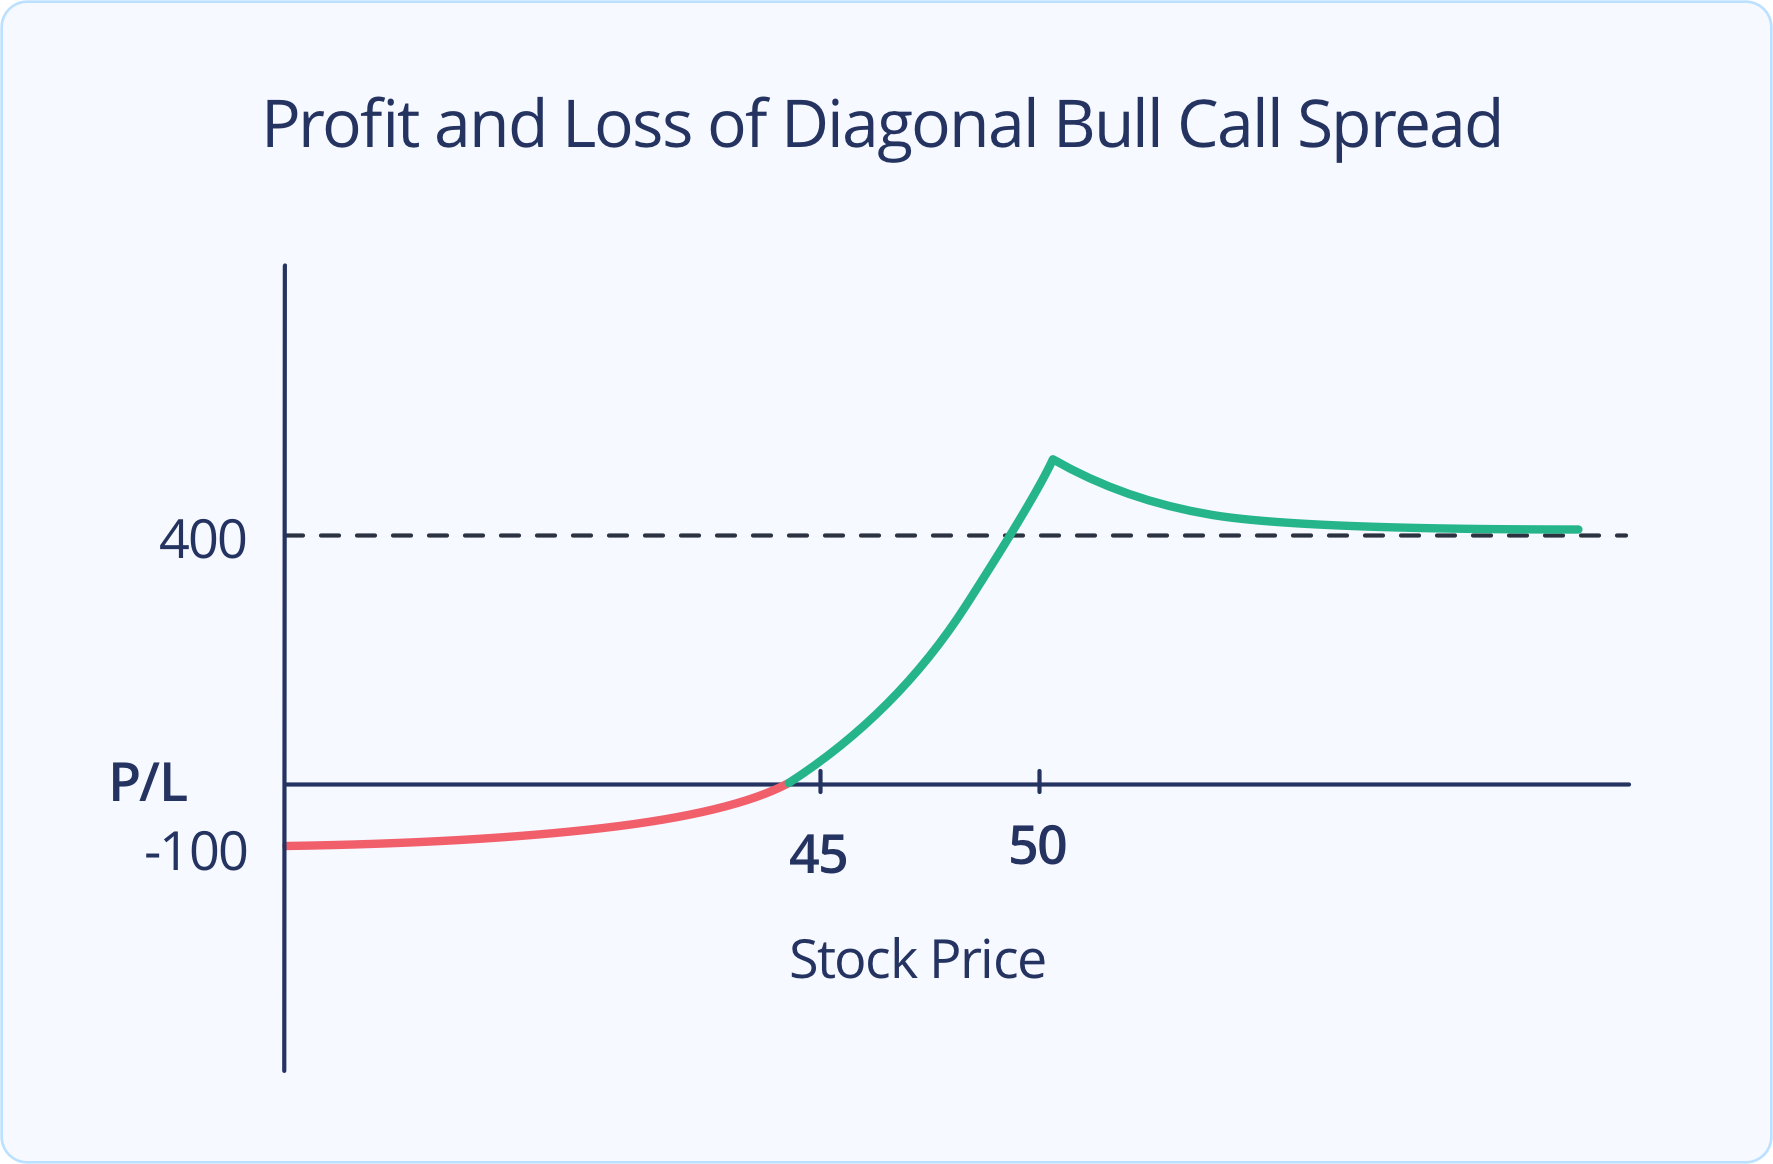
The graph depicts the profit and loss of the strategy at the expiration of the near-dated call option. In this example, the long call has a strike price of $45 and the near-dated call option has a strike of $50. In this case, the position is opened with a debit. The max profit of the position occurs when the underlying ends up just below the strike price of the short call at expiration. At this point, you can see that the max profit peaks here due to the remaining time value left in the long call option. The max profit is equal to the width of the spread times the standard share multiplier ($5 x 100 shares = $500) minus the opening debit, plus any extrinsic value left in the long call option. As the long call option moves deeper in the money, it's extrinsic value diminishes, eventually to the point where the profit is equal to the width of the spread less the initial debit. The max loss of this position occurs if the underlying price settles below the price of the long call option. Note, the remaining time value left in the long call option creates the curvature of the graph.
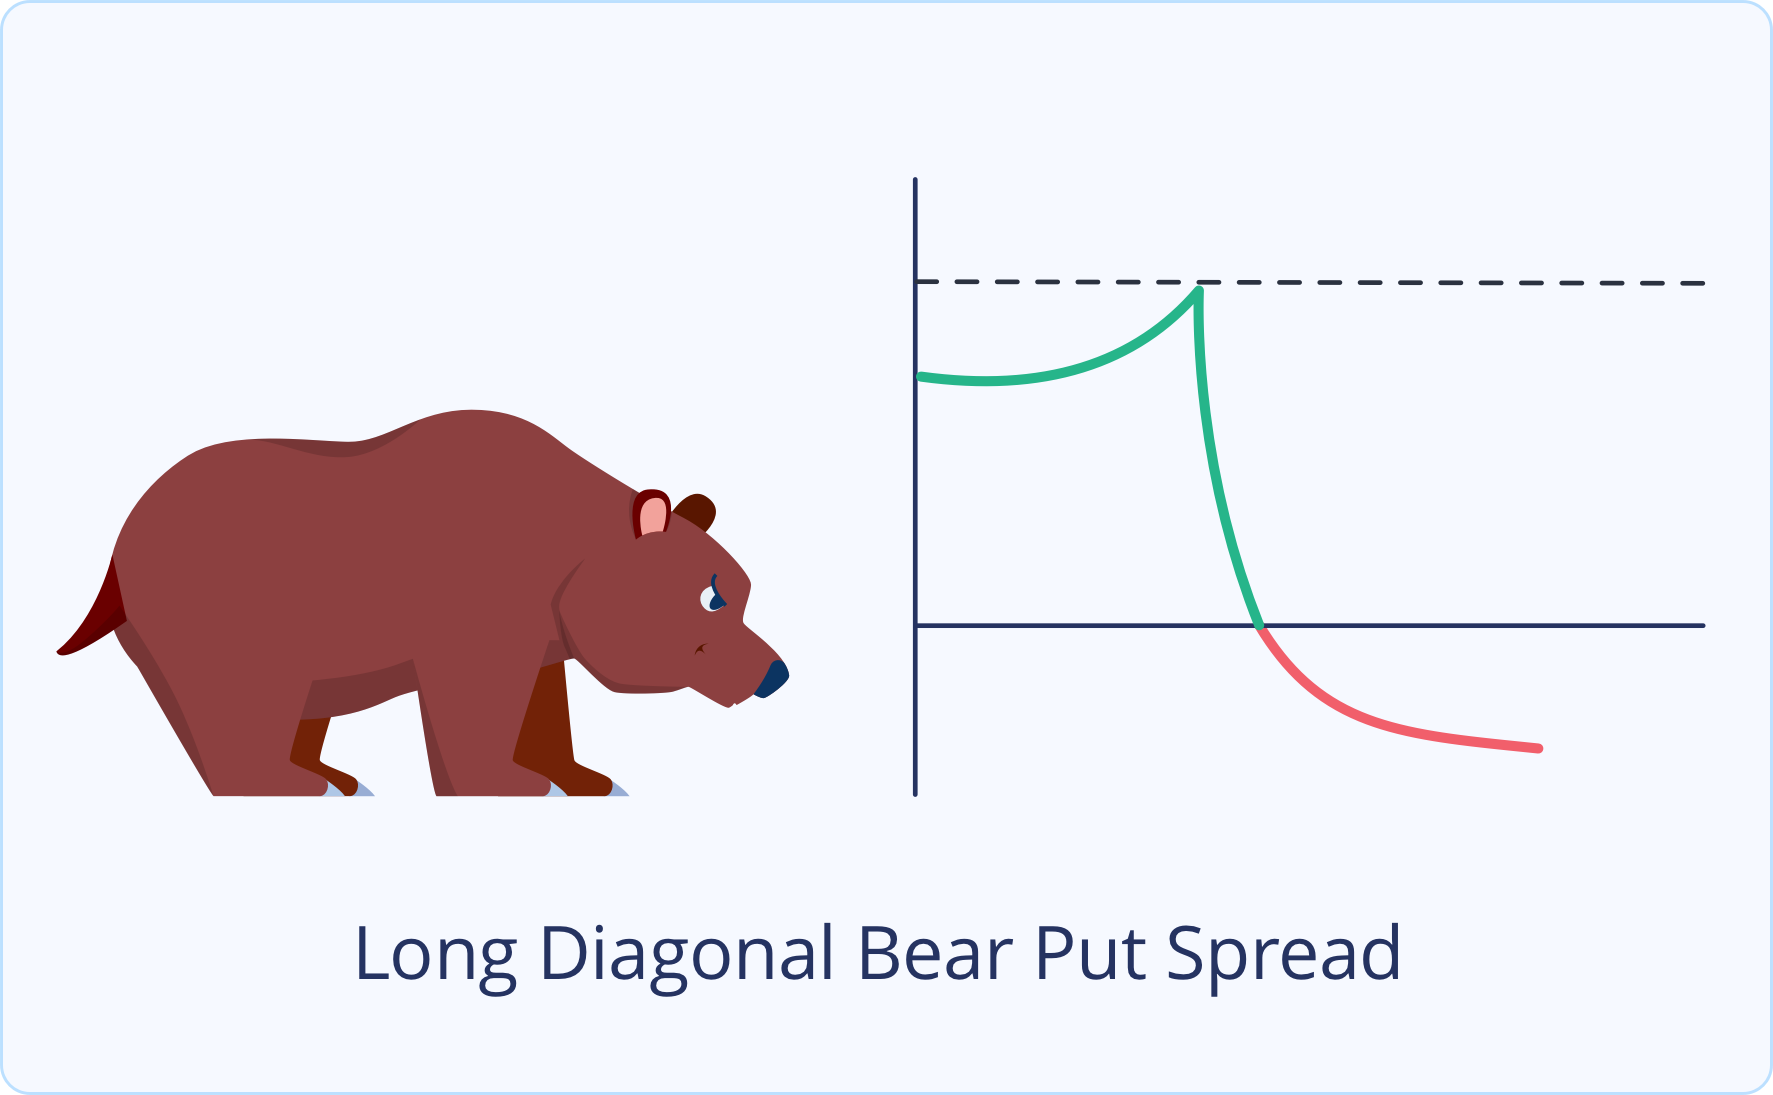
Long Diagonal Bear Put Spread
A diagonal bear put spread is typically constructed by buying an out-of-the-money put and selling a further out-of-the-money put with a shorter-term expiration date. The credit earned by selling the near-term put option helps offset the debit paid to buy the long-put option, leaving you with a lower net debit.
Ideally, you want the underlying price to move down to just above the strike price of the short put option, allowing your long put to go into the money and gain value while the short put expires out of the money. Time decay will impact the nearer-term option more than the longer-term option, so as time passes the short leg will lose its value more quickly than the long leg. Also, an increase in implied volatility can boost the price of the long put, so by the time the short put option expires, the long option may retain a significant amount of extrinsic value.
When the near-dated short put option expires there are several choices you can make depending on your outlook:
- Sell a short put option to create another diagonal spread
- Sell a short put option to create a vertical spread
- Sell a short put option to create a calendar spread
- Continue to hold the long put
- Sell the long put
An additional credit can be earned by selling another short put option (Choices 1-3). By selling an additional short put, you can reduce your net debit or even possibly generate a net credit on the trade. The further apart the expiration dates of the long and short legs, the more times this maneuver can potentially be executed.
However, if your outlook on the underlying turns more bearish, you can continue to hold the long-put option (Choice 4). Lastly, you can choose to close out the long-put option (Choice 5) to recoup what remains of its value.
Theoretical Pay-Off Chart of a Long Diagonal Bear Put Spread
The graph below shows a diagonal bear put spread that was opened at a net debit.
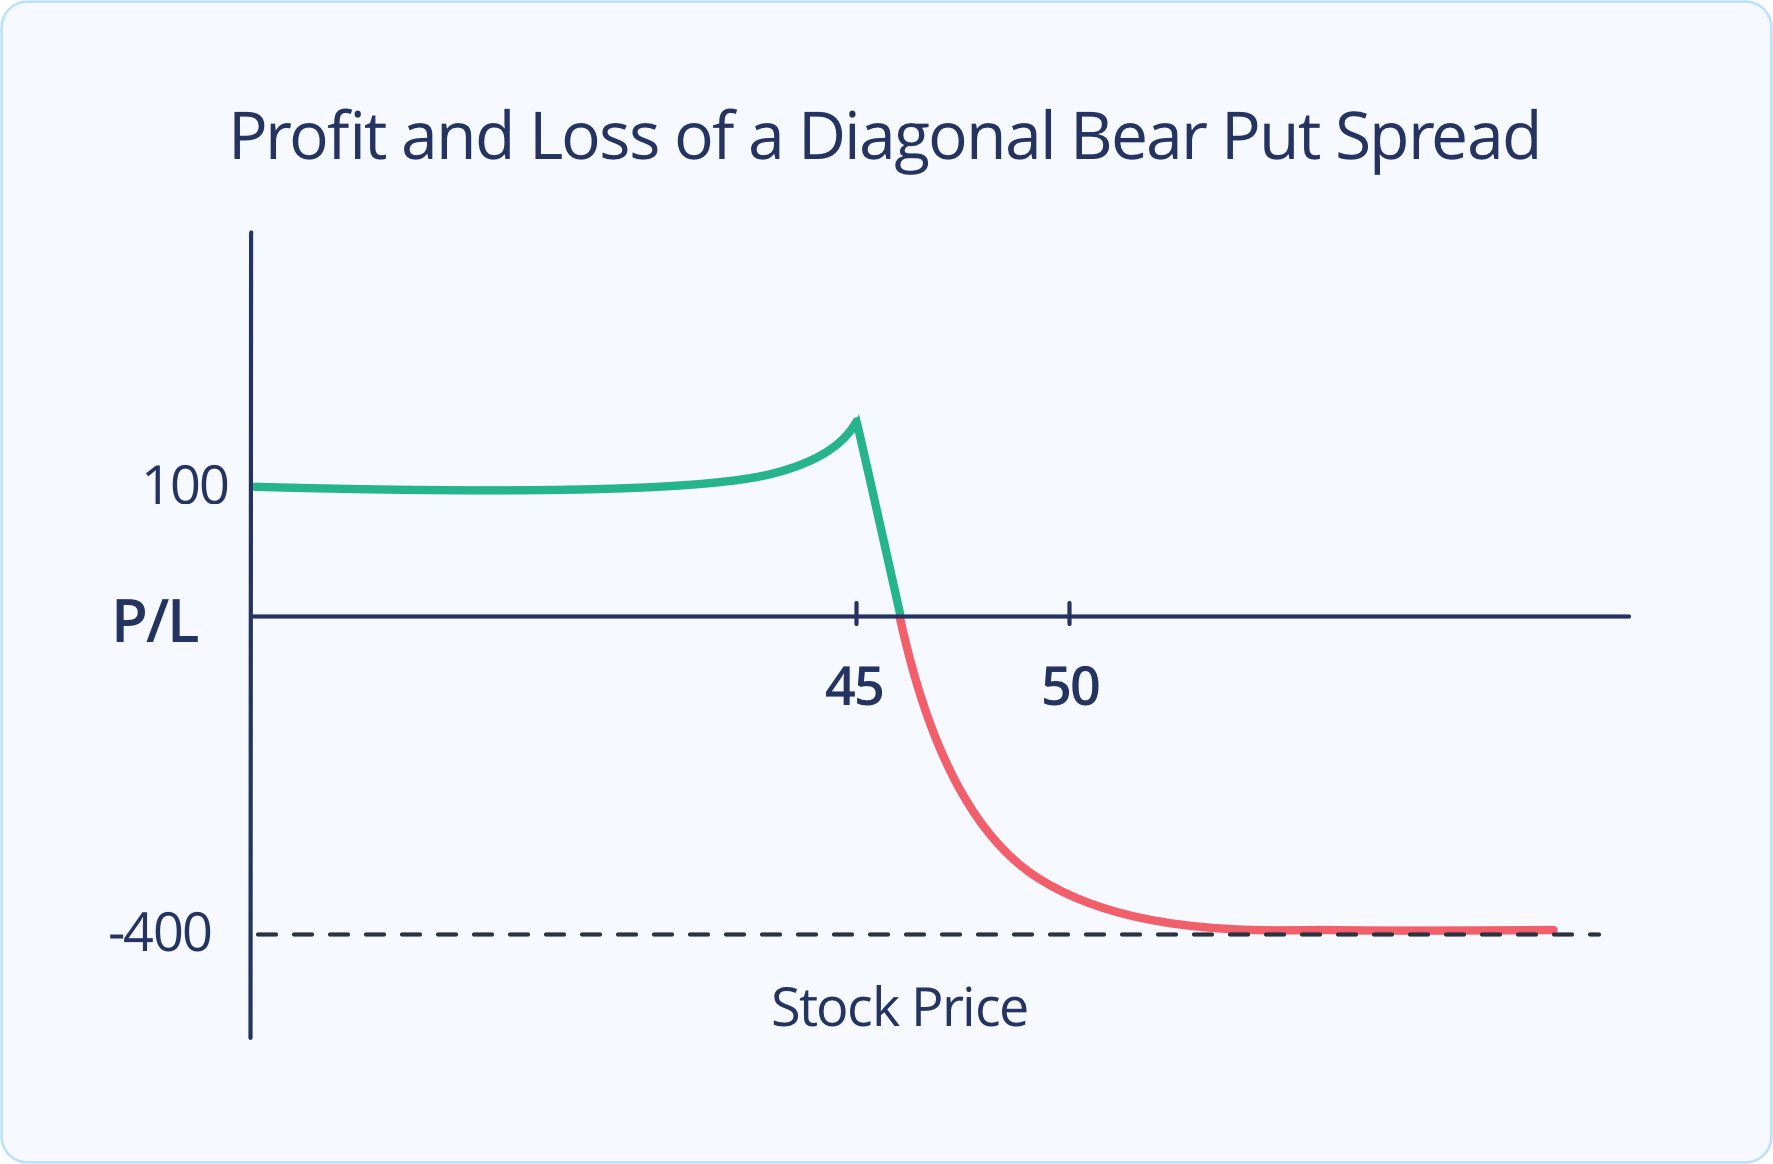
The graph depicts the profit and loss of the strategy at the expiration of the near dated put option. In this example, the long put has a strike price of $50 and the short put has a strike price of $45. In this case, the position is opened with a debit. The max profit of the position occurs when the underlying ends up just above the strike price of the short put at expiration. At this point the value of the long-put option exceeds the cost of the net debit. The max profit is equal to the width of the spread times the standard share multiplier ($5 x 100 shares = $500) minus the opening debit, plus any extrinsic value left in the long-put option. As the long-put option moves deeper in the money, its extrinsic value diminishes, eventually to the point where the profit equals the width of the spread less the initial debit. The max loss of this position occurs if the underlying price settles above the price of the long-put option. The plot of the graph is curved due to the time value of the long-put option.
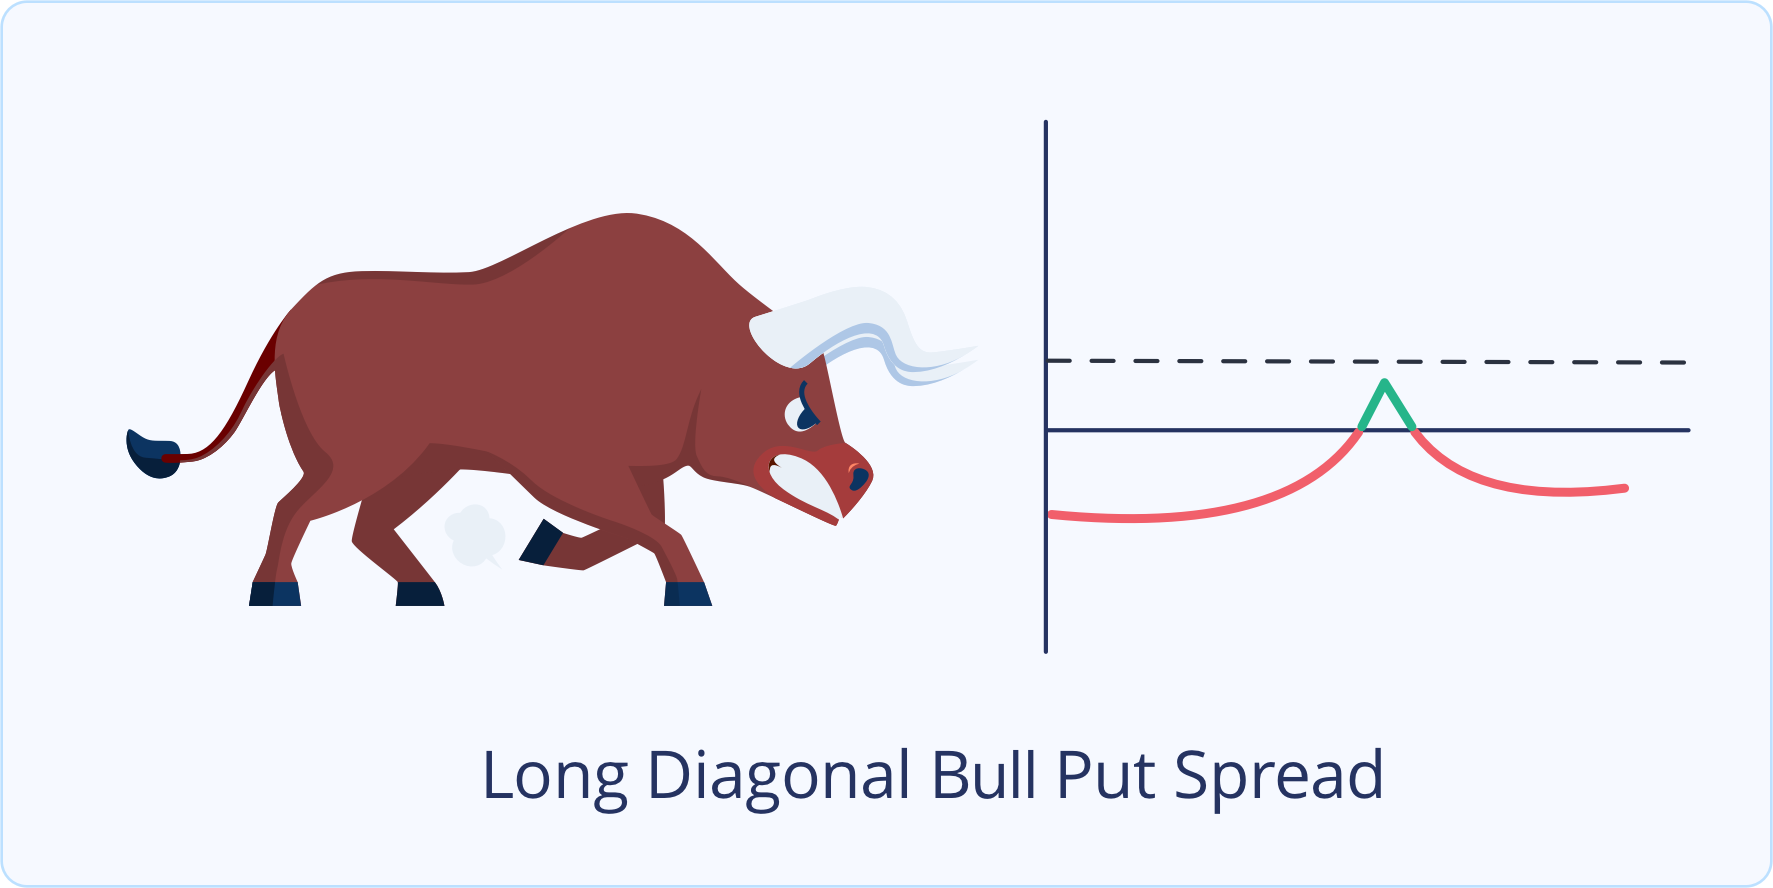
Long Diagonal Bull Put Spread
A diagonal bull put spread is typically constructed by selling an out-of-the-money put and buying a further out-of-the-money put with a longer-term expiration date. The credit earned by selling the near-term put option helps offset the debit paid to buy the long-put option, leaving you with a lower debit or even a net credit.
Ideally, you want the underlying price to move down to just above the strike price of the short put option, allowing the short put to expire out of the money. Time decay will impact the nearer-term option more than the longer-term option, so as time passes the short leg will lose its value more quickly than the long leg. Also, an increase in implied volatility can boost the price of the long put, so by the time the short put option expires, the long option may retain a significant amount of extrinsic value.
When the near-dated short put option expires there are several choices you can make depending on your outlook:
- Sell a short put option to create another diagonal spread
- Sell a short put option to create a vertical spread
- Sell a short put option to create a calendar spread
- Continue to hold the long put
- Sell the long put
An additional credit can be earned by selling another short put option (Choices 1-3). By selling an additional short put, you can reduce your net debit or even possibly generate a net credit on the trade. The further apart the expiration dates of the long and short legs, the more times this maneuver can potentially be executed.
However, if your outlook on the underlying turns bearish, you can continue to hold the long-put option (Choice 4). Lastly, you can choose to close out the long-put option (Choice 5) to recoup what remains of its value.
Theoretical Pay-Off Charts of a Long Diagonal Bull Put Spread
The graph below shows a diagonal bull put spread that was opened at a net debit.
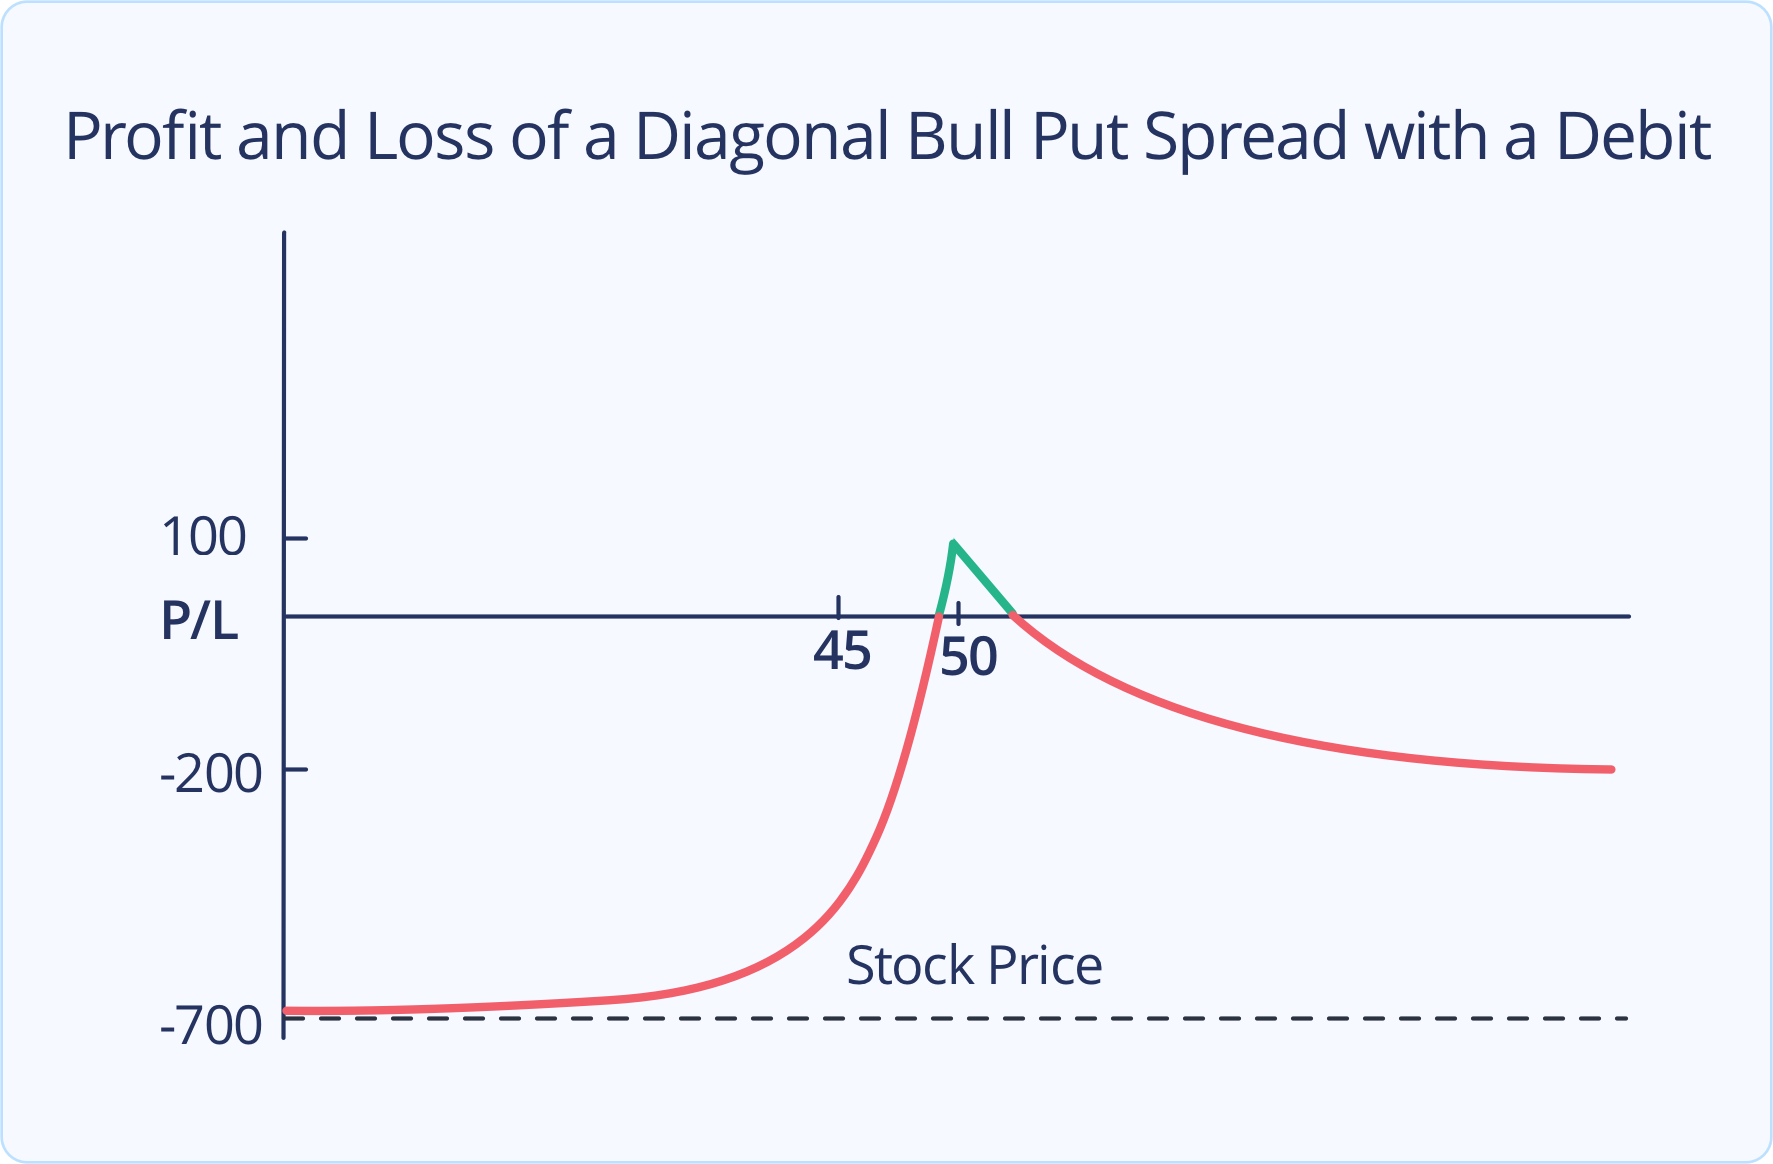
This graph depicts the profit and loss of the strategy at the expiration of the near-dated put option. In this example, the short put has a strike price of $50 and the long put has a strike price of $45. In this case, the position is opened with a debit. The max profit of the position occurs when the underlying ends up just above the strike price of the short put at expiration. At this point in this particular example, the value of the long-put option exceeds the cost of the net debit but this might not necessarily be the case every time. The max loss of this position occurs if the underlying price moves deep into the money on both options, with the max loss equal the width of the spread times the standard share multiplier ($5 x 100 shares = $500) plus the net debit. Note, the plot of the graph is curved due to the remaining time value left on the long-put option.
The graph below shows a diagonal bull put spread that was opened at a net credit.
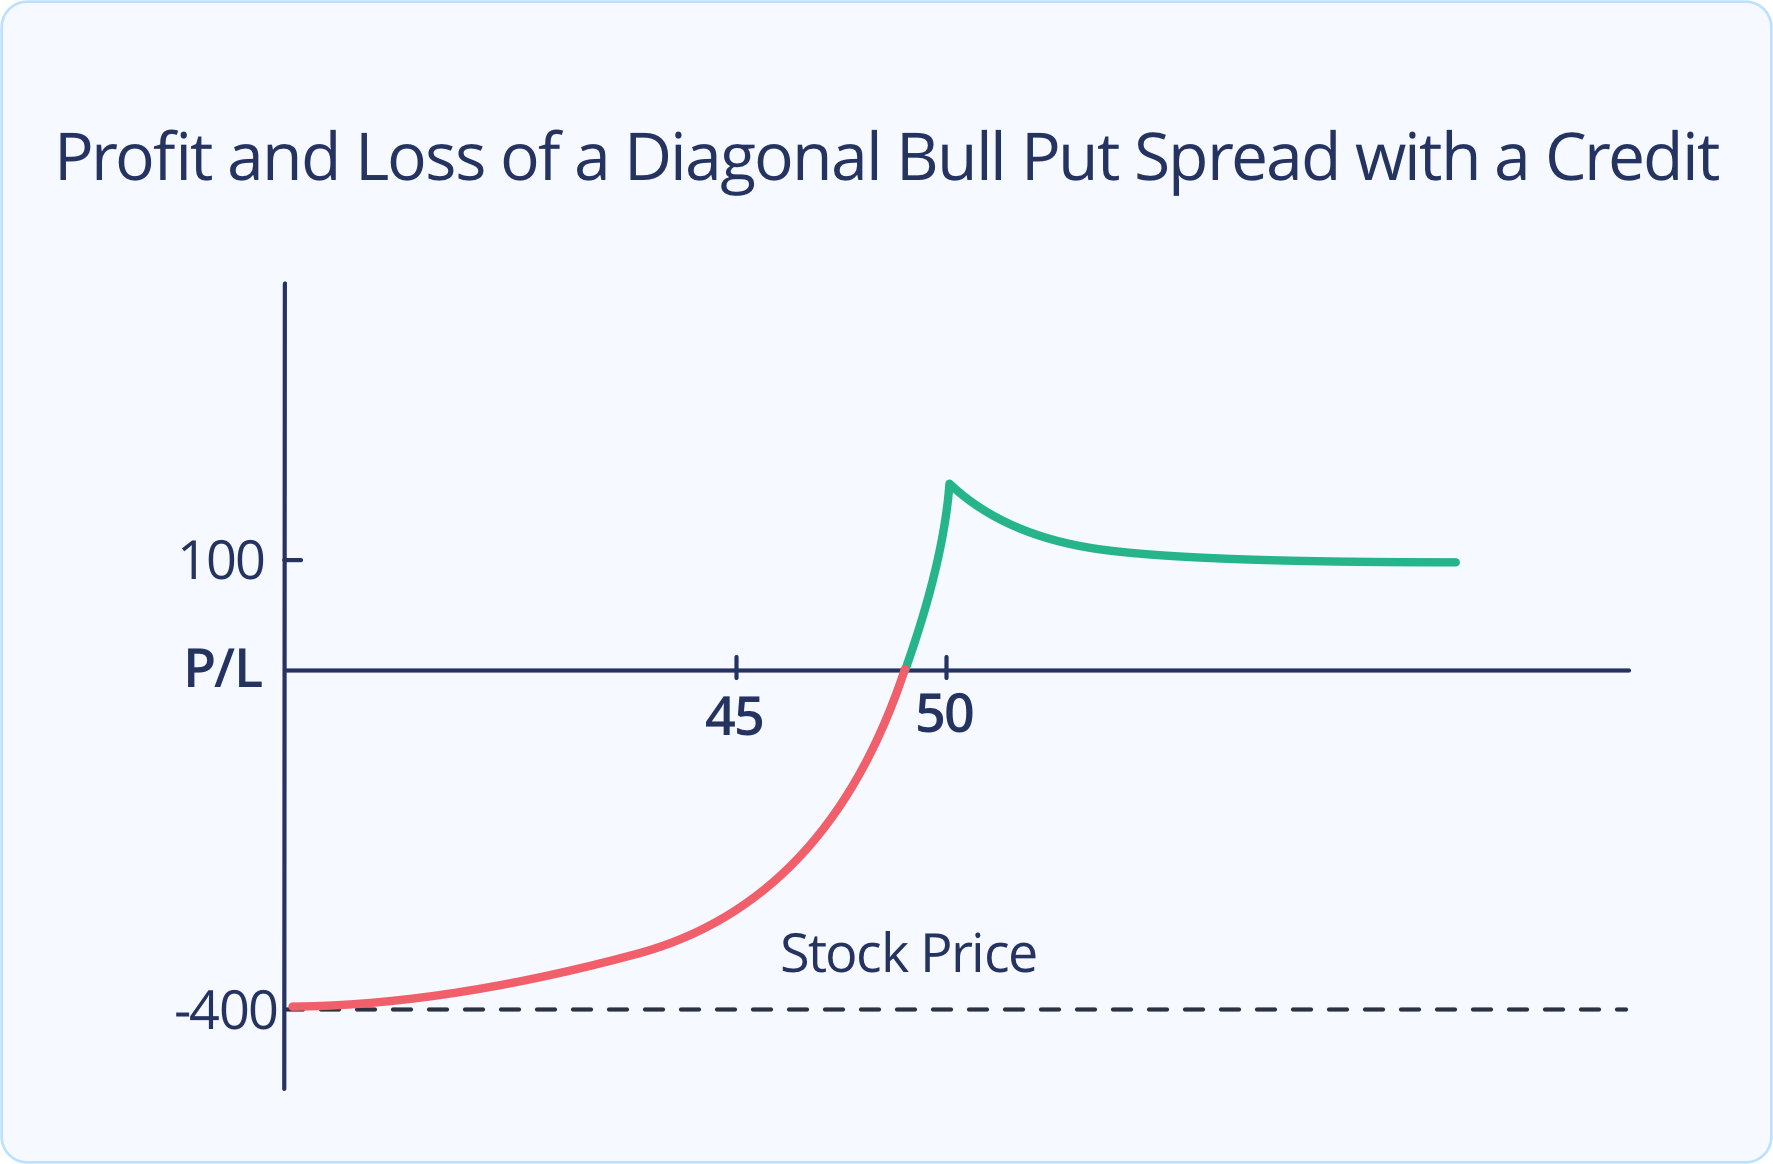
This graph depicts the profit and loss of the strategy at the expiration of the nearer-dated short put option. In this example, the short put has a strike price of $50 and the long put has a strike price of $45. In this case, the position is opened with a credit. The max profit of the position occurs when the underlying ends up just above the strike price of the short put at expiration. The max profit is equal to the opening credit plus any extrinsic value left in the long-put option. The max loss of this position occurs if the underlying price moves deep into the money of both options and is equal to the width of the spread times the standard share multiplier ($5 x 100 shares = $500) minus the net credit. The plot of the graph is curved due to the remaining time value left on the long-put option.
Conclusion
Diagonal spreads are one of the more advanced options strategies. Investors should be aware of all the nuances and complexities that they entail before trading them. In addition to understanding the set-ups and possible outcomes, investors need to know how to manage their risks when it comes to assignments. By utilizing Diagonal Spreads investors can construct positions that reduce costs, offer flexibility, and ultimately capitalize on predicted movements in the markets.
Options are risky and not suitable for everyone. Losses can exceed 100% of your initial deposit. Read Characteristics and Risks of Standardized Options available at webull.com/policy