
Trend Trading
Disclosure: Day trading is a high-risk investment strategy that requires thorough research and understanding of the associated risks. Please consider Webull's Day Trading Risk Disclosure.
What is trend trading?
Trend trading is a frequently used day trading strategy. In applying this strategy, traders identify a trend that has been established and follow it.
A security could be in an uptrend when its price moves up to higher highs and higher lows. The same stock could be in a downtrend when its price drops to lower highs and lower lows.
Day traders may apply a 2-minute, 5-minute or 15-minute chart to spot short-term trading opportunities. In the sections below, we’ll illustrate trend trading strategies on 2-minute and 5-minute charts.
Trend trading with trendlines
A trend can be identified with trendlines. First, uptrend lines are drawn by connecting two or more lows, while downtrend lines are drawn by connecting two or more highs.
Trend traders believe that an uptrend will continue so long as the price action stays above the uptrend line. Conversely, a downtrend may continue as long as the price action stays below the downtrend line.
Some tips when drawing trendlines:
- Connect the major swing points
- Get as many touches as possible
- Adjust the trend line when the momentum changes
Check here to see how to draw your own trendlines on charts.

As we can see above, in a 2-minute chart, day traders may open a long position when an uptrend is established and close the position when they see the price close below the trendline.
Likewise, they may open a short position when a downtrend is established. When the price closes above the trendline, they may close their short position.
Trend trading with MA
Trends can also be identified with moving averages, or MA. Just like a trendline can be seen as a support or resistance level, MA can be applied to enter or exit a trend.
In an uptrend, price action stays above the MA. A closing price below the MA signals the uptrend is coming to an end.
In a downtrend, price action stays below the MA. A closing price above the MA signals the downtrend is coming to an end.
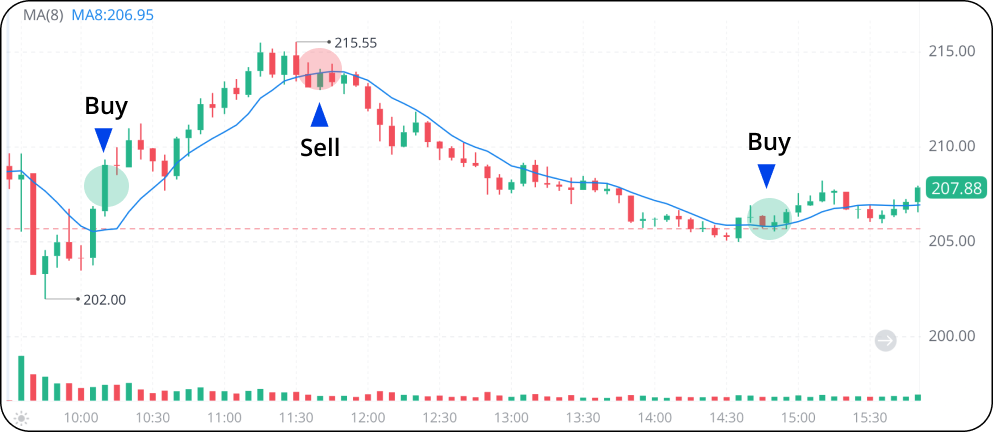
In the example above, we use an 8-D simple MA on a 5-minute chart.
We must note, however, an MA with a specific period does not work on every chart. If you’re day trading, an MA with a shorter period is commonly used.
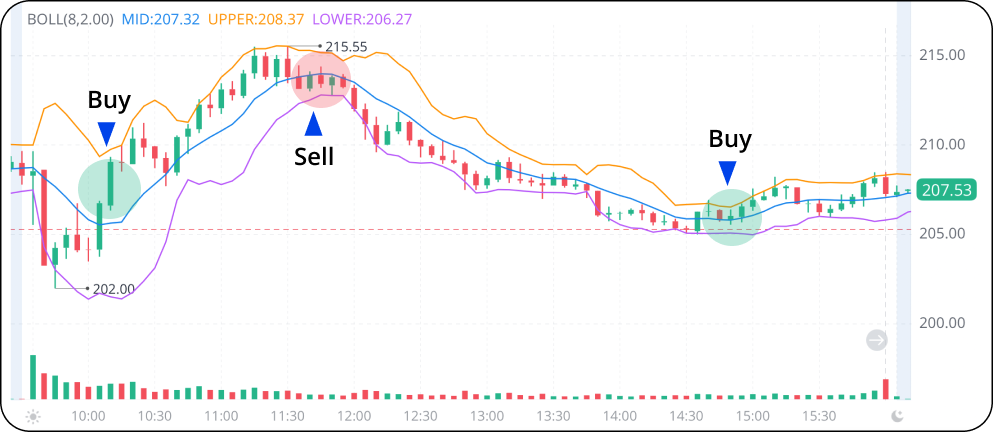
Trend trading with Bollinger Bands
Traders can also use Bollinger Bands to create trendlines.
When the price is in an uptrend, it will typically run along the upper band above the middle band. When it starts to close below the middle band, the uptrend may end.
When the price is in a downtrend, it will typically run along the lower band below the middle band. When the price climbs above the middle band, the downtrend may end.
The Bottom Line
Trend trading may be an effective trading strategy for day traders. However, there is no guarantee it will succeed every time.
Day traders should combine the results of trendlines, MA, and Bollinger Bands to make a trading decision. They should also use other technical indicators, such as RSI, to confirm a trend. In any scenario, traders should always take measures to stop losses.
