'%3e %3cpath d='M41.7832962%2c0 C41.9459106%2c0 42.0882746%2c0.0866854658 42.1666825%2c0.216359069 C43.8289923%2c2.66540836 44.7676281%2c5.46271319 44.7676281%2c8.43208061 C44.7676281%2c18.1345746 34.7460532%2c26 22.383814%2c26 C10.0215749%2c26 0%2c18.1345746 0%2c8.43208061 C0%2c5.46716016 0.935826425%2c2.67378733 2.58829888%2c0.223985685 C2.67109477%2c0.0916264068 2.81687473%2c0 2.9840593%2c0 C3.23130408%2c0 3.43173558%2c0.200393004 3.43173558%2c0.447590303 C3.43173558%2c0.475056669 3.42926112%2c0.501945205 3.42452292%2c0.528045226 L3.41810883%2c0.550292077 C3.37800671%2c0.861741908 3.3575721%2c1.17661276 3.3575721%2c1.49443092 C3.3575721%2c7.98336 11.2132389%2c12.5742305 22.383814%2c12.5742305 C33.5543891%2c12.5742305 41.410056%2c7.98336 41.410056%2c1.49443092 C41.410056%2c1.17865223 41.3898828%2c0.865783153 41.3502888%2c0.556288325 C41.3402868%2c0.521941442 41.3356199%2c0.48531078 41.3356199%2c0.447590303 C41.3356199%2c0.200393004 41.5360514%2c0 41.7832962%2c0 Z' id='logo%e5%a4%87%e4%bb%bd-6' fill='white'%3e%3c/path%3e %3cpath d='M74.6899231%2c3.74404927 C75.2411227%2c3.74404927 75.7734299%2c3.66184338 76.2756219%2c3.50883715 L73.8159676%2c20.8666902 C73.5770593%2c22.5662954 72.8072434%2c23.0518969 71.4268838%2c23.0518969 L69.9934336%2c23.0518969 C68.7988917%2c23.0518969 68.1618027%2c22.458384 67.7901674%2c20.893668 L65.6930827%2c11.9909739 C65.639992%2c11.7481731 65.639992%2c11.6942174 65.5338105%2c11.6942174 C65.427629%2c11.6942174 65.4010836%2c11.7481731 65.3479929%2c11.9909739 L63.2509082%2c20.893668 C62.8792729%2c22.458384 62.2421839%2c23.0518969 61.047642%2c23.0518969 L59.6141918%2c23.0518969 C58.2338322%2c23.0518969 57.4640163%2c22.5662954 57.225108%2c20.8666902 L54.7463723%2c3.37406084 C55.3593498%2c3.61307396 56.0249975%2c3.74404927 56.7207458%2c3.74404927 C57.3314263%2c3.74404927 57.918917%2c3.64314414 58.4679557%2c3.4568446 L60.3574623%2c19.3829078 C60.3840076%2c19.6257086 60.3840076%2c19.7875757 60.4901891%2c19.7875757 C60.5963706%2c19.7875757 60.5963706%2c19.6257086 60.6494614%2c19.3829078 L62.9323637%2c9.91367858 C63.0916359%2c9.26620991 63.4632712%2c8.69967483 64.6047223%2c8.69967483 L66.4363532%2c8.69967483 C67.5778044%2c8.69967483 67.9494397%2c9.26620991 68.1087119%2c9.91367858 L70.3916142%2c19.3829078 C70.4447049%2c19.6257086 70.4447049%2c19.7875757 70.5508864%2c19.7875757 C70.6570679%2c19.7875757 70.6570679%2c19.6257086 70.6836133%2c19.3829078 L72.5891207%2c3.32292288 C73.2365902%2c3.59432921 73.9460524%2c3.74404927 74.6899231%2c3.74404927 Z' id='Combined-Shape' fill='white'%3e%3c/path%3e %3cpath d='M84.5933901%2c7.43171536 C88.6813779%2c7.43171536 90.9111894%2c10.2643908 90.9111894%2c14.2840921 L90.9111894%2c15.7948523 C90.9111894%2c16.2264981 90.7519172%2c16.4692988 90.3802819%2c16.4692988 L81.7264895%2c16.4692988 L81.7264895%2c16.5502324 C81.7264895%2c18.1149484 82.3635785%2c19.9764208 84.9119346%2c19.9764208 C86.849747%2c19.9764208 88.6813779%2c19.8145536 89.7962837%2c19.7066422 L89.8759198%2c19.7066422 C90.1413735%2c19.7066422 90.3537366%2c19.8415315 90.3537366%2c20.1113101 L90.3537366%2c21.8918489 C90.3537366%2c22.3234947 90.2741004%2c22.5123397 89.7962837%2c22.5932733 C88.0708343%2c22.9170076 87.0355646%2c23.0518969 84.6464808%2c23.0518969 C81.9919433%2c23.0518969 78.2225%2c21.5950924 78.2225%2c16.2804538 L78.2225%2c14.2840921 C78.2225%2c10.0755457 80.5319476%2c7.43171536 84.5933901%2c7.43171536 Z M84.5933901%2c10.5071915 C82.9475768%2c10.5071915 81.7530349%2c11.6942174 81.7530349%2c13.8254684 L81.7530349%2c13.9333799 L87.3806545%2c13.9333799 L87.3806545%2c13.8254684 C87.3806545%2c11.7211953 86.2392034%2c10.5071915 84.5933901%2c10.5071915 Z' id='Combined-Shape' fill='white'%3e%3c/path%3e %3cpath d='M97.4154906%2c2.98826245 L97.4148064%2c7.62056039 C98.3969853%2c7.48567108 99.3260735%2c7.43171536 99.9631625%2c7.43171536 C104.236968%2c7.43171536 106.307507%2c9.99461216 106.307507%2c14.2031585 L106.307507%2c16.2804538 C106.307507%2c20.4890001 104.236968%2c23.0518969 99.9631625%2c23.0518969 C98.2642584%2c23.0518969 96.2733553%2c22.7821183 94.627542%2c22.3504725 C94.0169984%2c22.1886054 93.9108169%2c22.0267382 93.9108169%2c21.6220703 L93.9098179%2c3.08694115 C94.4185466%2c3.24434375 94.9584615%2c3.32900525 95.5178331%2c3.32900525 C96.184659%2c3.32900525 96.8238351%2c3.20869291 97.4154906%2c2.98826245 Z M99.9631625%2c10.3453244 C99.3260735%2c10.3453244 98.1580769%2c10.4262579 97.4148064%2c10.5341694 L97.4148064%2c19.9494429 C97.9191686%2c20.0573544 99.007529%2c20.1382879 99.9631625%2c20.1382879 C102.246065%2c20.1382879 102.803518%2c18.4926384 102.803518%2c16.2804538 L102.803518%2c14.2031585 C102.803518%2c11.9909739 102.246065%2c10.3453244 99.9631625%2c10.3453244 Z' id='Combined-Shape' fill='white'%3e%3c/path%3e %3cpath d='M111.036668%2c8.72457747 C111.579488%2c8.72457747 112.103987%2c8.64485191 112.599444%2c8.49629404 L112.598761%2c16.5232546 C112.598761%2c19.3289521 113.607485%2c19.9764208 115.147117%2c19.9764208 L115.306389%2c19.9764208 C116.846021%2c19.9764208 117.854746%2c19.3289521 117.854746%2c16.5232546 L117.854207%2c8.4334735 C118.406525%2c8.62226395 118.997939%2c8.72457747 119.612866%2c8.72457747 C120.223332%2c8.72457747 120.810625%2c8.62374317 121.359498%2c8.43756894 L121.358735%2c16.5232546 C121.358735%2c22.4044283 116.872567%2c23.0518969 115.306389%2c23.0518969 L115.060464%2c23.0512514 C113.42215%2c23.0271041 109.094772%2c22.2994073 109.094772%2c16.5232546 L109.094446%2c8.36700801 C109.698522%2c8.59813531 110.353066%2c8.72457747 111.036668%2c8.72457747 Z' id='Combined-Shape' fill='white'%3e%3c/path%3e %3cpath d='M128.314162%2c3.03790128 L128.313623%2c22.269539 C128.313623%2c22.5662954 128.10126%2c22.836074 127.809261%2c22.836074 L125.340541%2c22.836074 C125.048542%2c22.836074 124.809634%2c22.5662954 124.809634%2c22.269539 L124.809455%2c3.04219481 C125.358161%2c3.22824247 125.945253%2c3.32900525 126.555503%2c3.32900525 C127.17043%2c3.32900525 127.761844%2c3.22669173 128.314162%2c3.03790128 Z' id='Combined-Shape' fill='white'%3e%3c/path%3e %3cpath d='M133.90653%2c3.32900525 C134.473329%2c3.32900525 135.02015%2c3.24208064 135.534793%2c3.08063296 L135.533966%2c22.269539 C135.533966%2c22.5662954 135.321603%2c22.836074 135.029603%2c22.836074 L132.560884%2c22.836074 C132.268884%2c22.836074 132.029976%2c22.5662954 132.029976%2c22.269539 L132.029909%2c2.99605058 C132.615669%2c3.21152525 133.2476%2c3.32900525 133.90653%2c3.32900525 Z' id='Combined-Shape' fill='white'%3e%3c/path%3e %3c/g%3e %3c/g%3e %3c/g%3e%3c/svg%3e)



Quantitative tightening (QT) is one of the Federal Reserve's most consequential — yet least understood — monetary policy tools. When inflation runs high or financial conditions need to normalize, the Fed turns to QT to reduce the money supply and pull liquidity out of the economy. Understanding how QT works, its historical record, and its potential impact on interest rates and asset prices is essential for any US investor monitoring the macro environment.
Key Takeaways
Quantitative tightening (QT) is the process by which the Fed shrinks its balance sheet, reducing the money supply and putting upward pressure on interest rates.
QT is the direct opposite of quantitative easing (QE), which expands the balance sheet to stimulate the economy.
The Fed has conducted two major QT programs: one from 2017 to 2019 and another starting in June 2022.
QT's effects on broader economic activity may be more modest than QE's, according to research from the St. Louis Fed.
Investors can use tools like Webull's market research, economic indicators, and Quant Ratings to monitor how macro conditions evolve during QT cycles.
Part 1. What Is Quantitative Tightening? Definition and Core Mechanics
Quantitative tightening defined
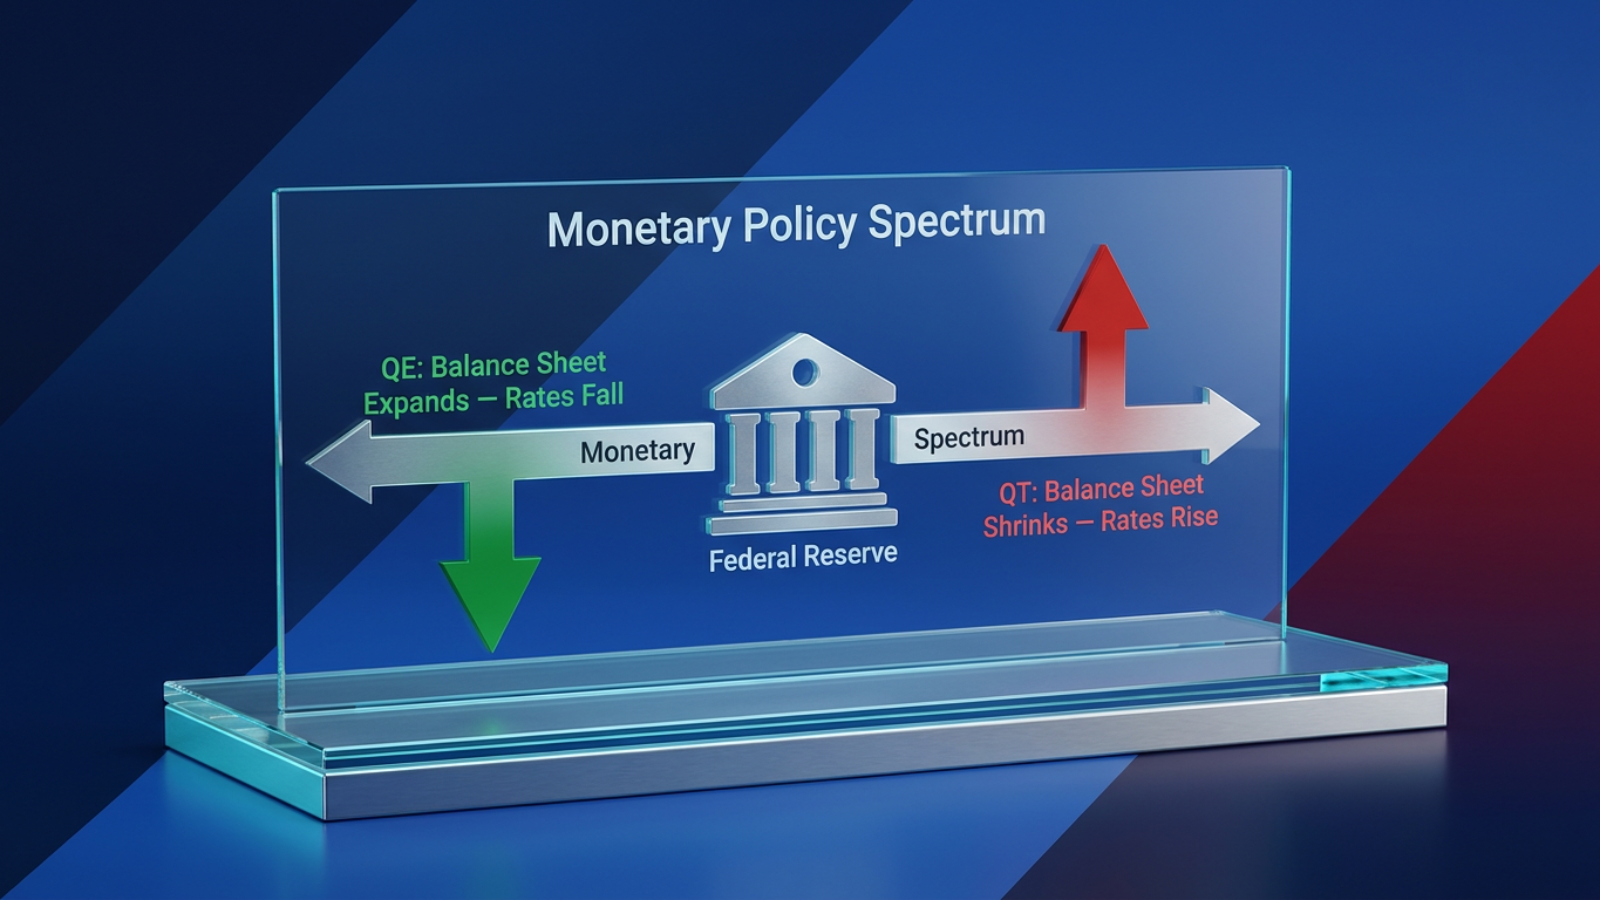
Quantitative tightening (QT) is a contractionary monetary policy tool used by central banks to decrease the amount of liquidity or money supply in the economy. A central bank implements QT by reducing the financial assets it holds on its balance sheet — either by selling them into financial markets or by letting them mature without reinvestment.
Wikipedia — https://en.wikipedia.org/wiki/Quantitative_tightening
QT vs. QE: The essential contrast
To understand QT, it helps to start with its opposite. Quantitative easing (QE) refers to policies that substantially expand the size of the Fed's balance sheet. The Fed buys longer-term Treasury securities and mortgage-backed securities (MBS), injecting money into the financial system. QT refers to the opposite — policies that reduce the size of that balance sheet.
Federal Reserve Bank of St. Louis — https://www.stlouisfed.org/open-vault/2019/july/what-is-quantitative-tightening
How the mechanics work
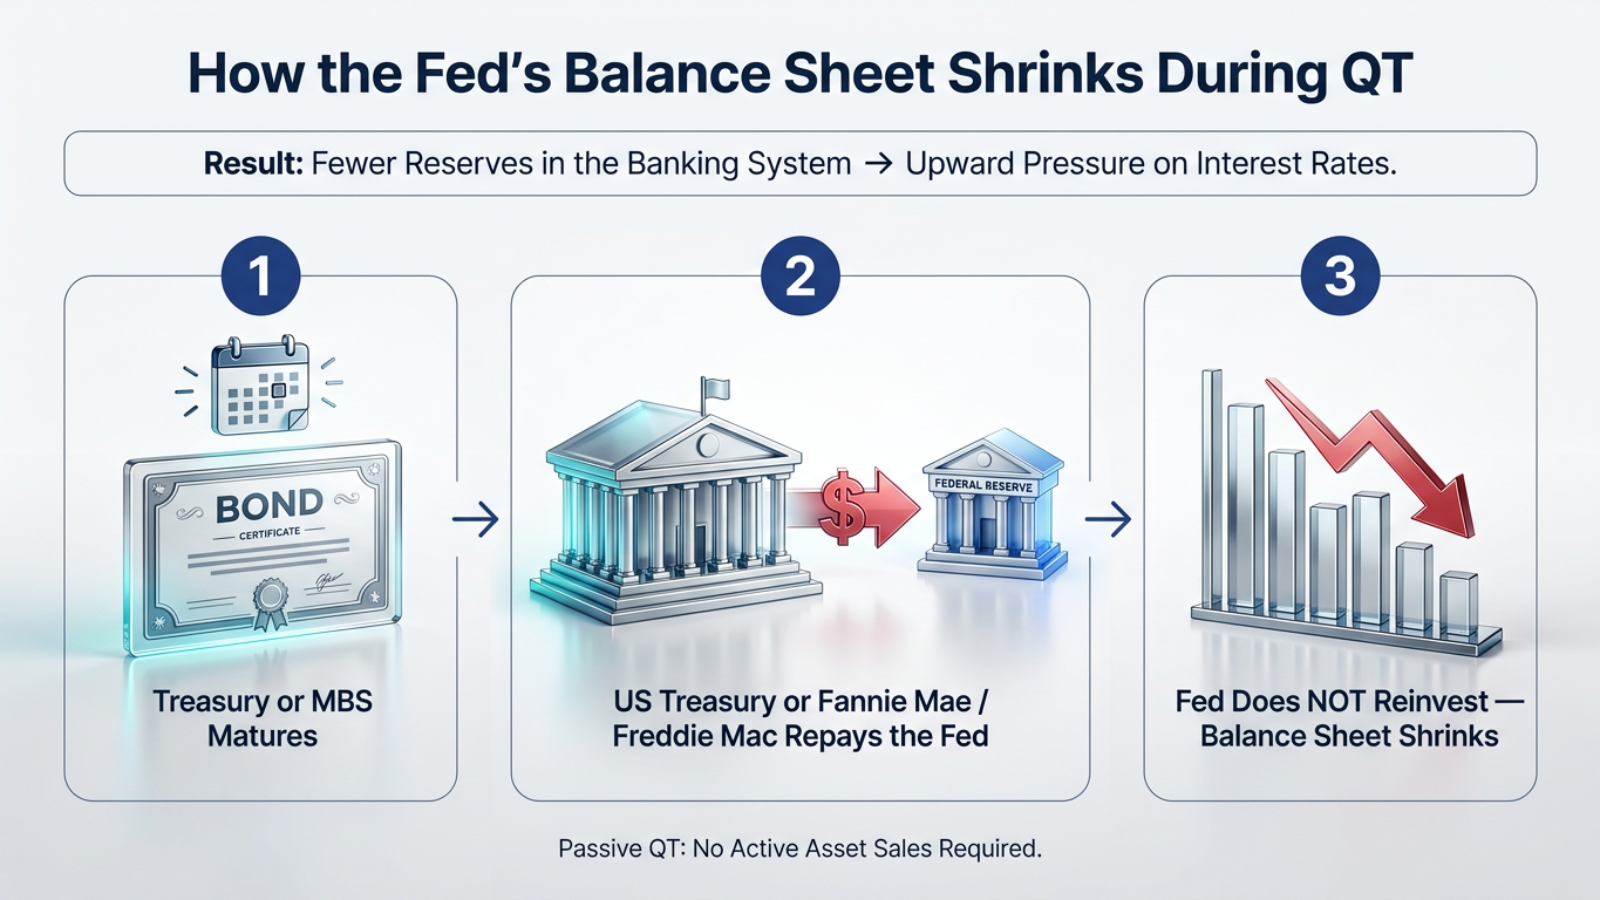
When the Fed conducts QT, it stops replacing securities that mature. Instead of going into the market to purchase new securities to keep the balance sheet constant, the Fed simply allows those maturing bonds to "roll off." Treasury securities are paid off by the government; MBS are paid off by Fannie Mae and Freddie Mac. That cash is no longer recycled back into the market.
Federal Reserve Bank of St. Louis — https://www.stlouisfed.org/open-vault/2019/july/what-is-quantitative-tightening
Why the Fed uses QT
The main goal of QT is to normalize interest rates — specifically, to raise them — in order to avoid increasing inflation. By reducing the supply of money and raising the cost of accessing credit, QT aims to slow demand for goods and services throughout the economy.
Wikipedia — https://en.wikipedia.org/wiki/Quantitative_tightening
The Fed's balance sheet: assets and liabilities
The Fed's balance sheet is made up of assets and liabilities. The asset side is mainly US Treasuries and agency mortgage-backed securities. The liability side includes cash in circulation, bank reserves held at the Fed, and the Treasury General Account (TGA). QT reduces the asset side, which in turn draws down bank reserves — a key variable the FOMC must manage carefully.
Part 2. A Brief History of QT: From 2017 to 2022 and Beyond
2.1 The Great Recession and the Rise of QE
The US experienced a financial crisis and recession from 2007 to 2009. In response, the Federal Open Market Committee (FOMC) kept the federal funds rate near zero and launched three large-scale asset purchase programs — QE1, QE2, and QE3. These programs involved purchasing agency debt, MBS, and longer-term Treasuries.
Federal Reserve Bank of St. Louis — https://www.stlouisfed.org/open-vault/2019/july/what-is-quantitative-tightening
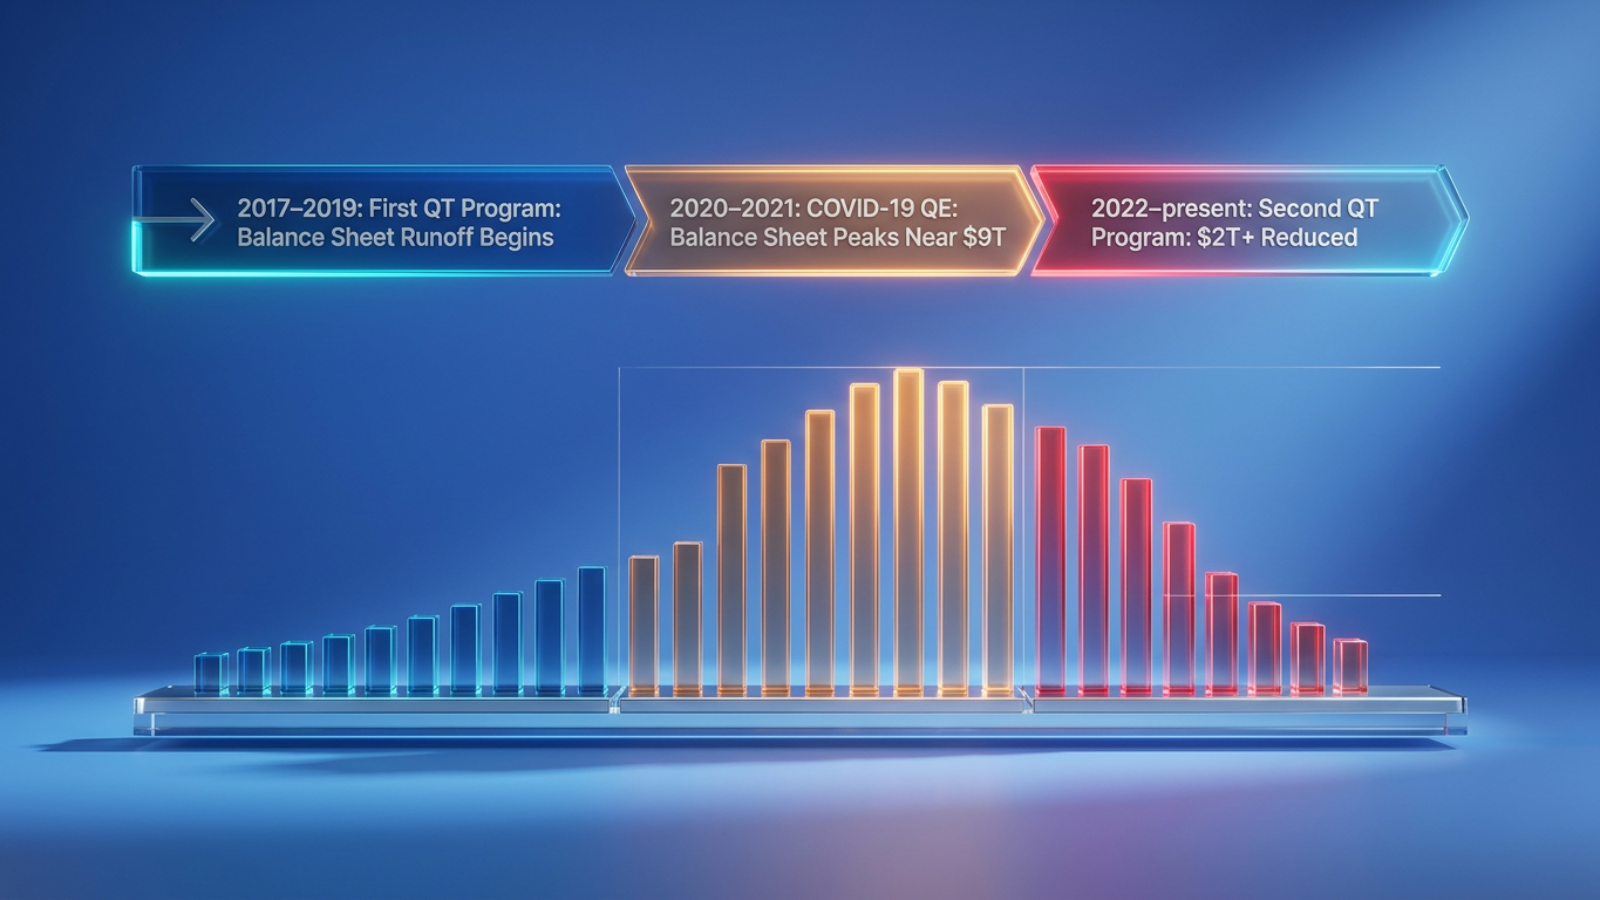
By the time QE3 ended in October 2014, the Fed's balance sheet had grown from less than $900 billion before the recession to roughly $4.5 trillion. The FOMC maintained that balance sheet size until late 2017.
Federal Reserve Bank of St. Louis — https://www.stlouisfed.org/open-vault/2019/july/what-is-quantitative-tightening
2.2 The First QT Program: 2017–2019
After raising the federal funds rate from 0%–0.25% in December 2015 and through several subsequent increases, the FOMC announced its balance sheet normalization program in September 2017. It officially began in October 2017.
The Fed used a "cap" structure to ensure a gradual decline: capped amounts of maturing securities were allowed to roll off each month. Caps started at $6 billion per month for Treasuries and $4 billion per month for agency debt and MBS, rising each quarter until reaching $30 billion and $20 billion per month, respectively.
Federal Reserve Bank of St. Louis — https://www.stlouisfed.org/open-vault/2019/july/what-is-quantitative-tightening
In March 2019, the FOMC reduced the Treasury runoff cap from $30 billion to $15 billion per month. The FOMC ended the balance sheet runoff in July 2019 — earlier than initially planned — partly in response to money market volatility that had emerged.
Federal Reserve Bank of St. Louis — https://www.stlouisfed.org/open-vault/2019/july/what-is-quantitative-tightening
2.3 COVID-19 QE and the Second QT Program Beginning 2022
The COVID-19 pandemic prompted a new round of massive QE. The Fed's balance sheet rose to a peak of nearly $9 trillion — roughly 35% of US GDP. In June 2022, facing historically high inflation driven by pandemic-era fiscal and monetary stimulus, the Fed reintroduced QT.
By late 2024, the Fed had reduced the balance sheet by more than $2 trillion from that peak. According to data through March 2025, the overall Federal Reserve balance sheet dropped by $2.19 trillion since the start of the most recent QT round in June 2022, and total security holdings fell by $2.05 trillion.
Federal Reserve Bank of Cleveland — https://www.clevelandfed.org/publications/economic-commentary/2025/ec-202505-qt-ample-reserves-changing-fed-balance-sheet
Part 3. How Quantitative Tightening Affects Financial Markets
3.1 Interest Rates and Bond Yields
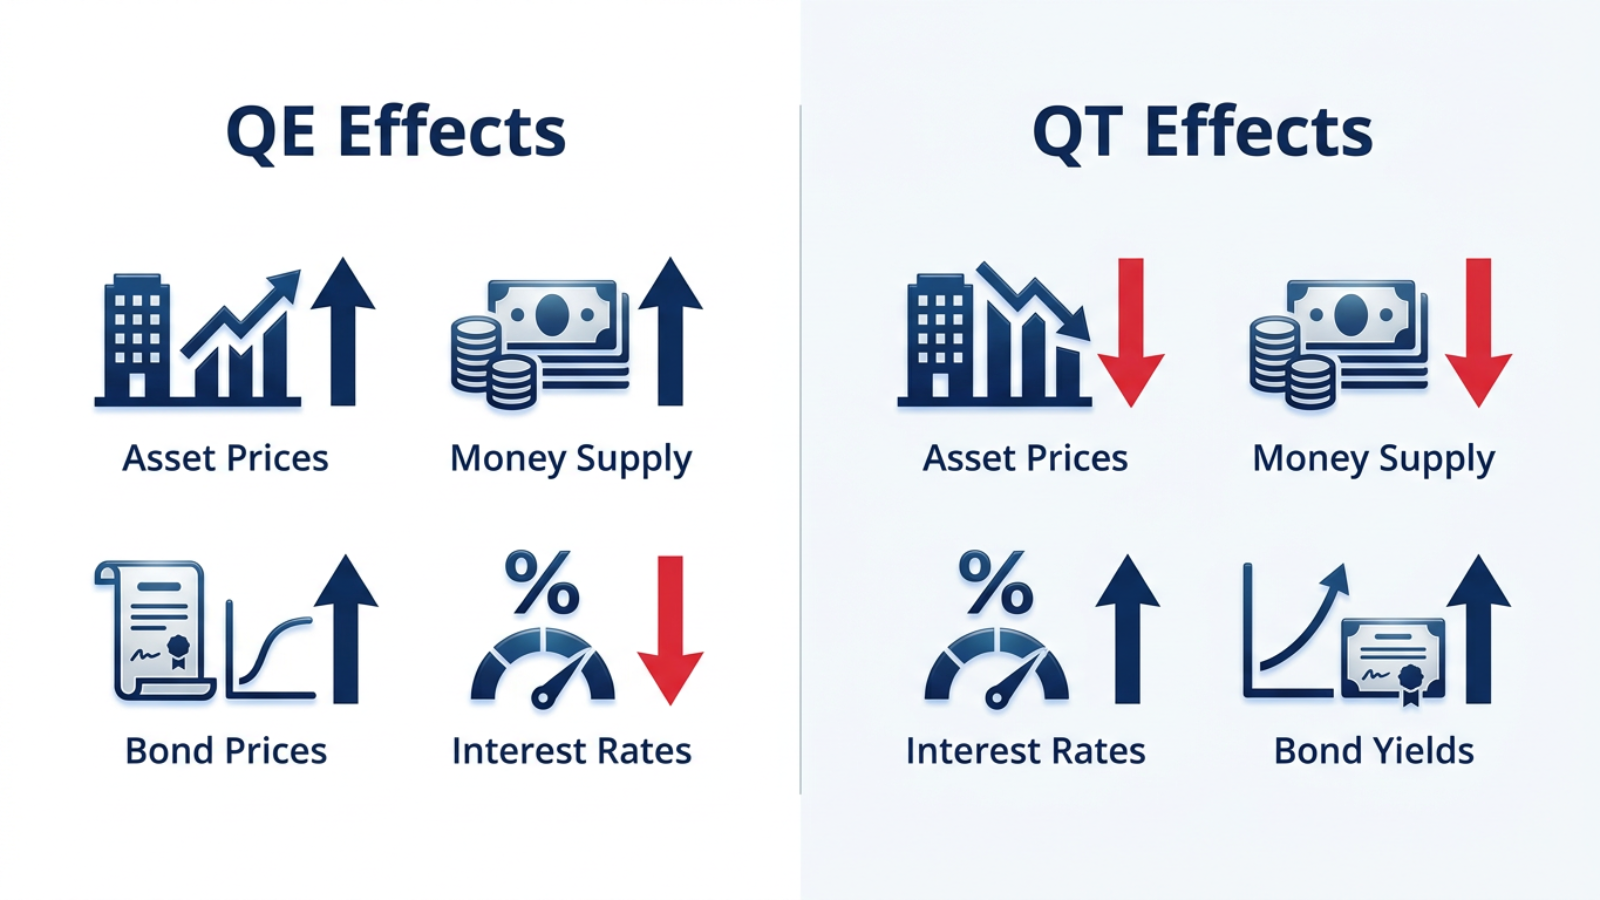
If QE was intended to reduce longer-term interest rates — research indicates the Fed's asset purchases from 2008–2013 jointly reduced 10-year Treasury yields by 100 to 200 basis points — then QT might be expected to reverse those effects. However, the picture is more nuanced.
Federal Reserve Bank of St. Louis — https://www.stlouisfed.org/open-vault/2019/july/what-is-quantitative-tightening
St. Louis Fed Vice President Christopher Neely wrote in 2019 that quantitative tightening "is unlikely to significantly impede economic activity." He noted that most of the yield reductions from the Fed's unconventional policies were probably already undone, some effects would not be reversed, and the remaining effects would likely disappear gradually over many years.
Federal Reserve Bank of St. Louis — https://www.stlouisfed.org/open-vault/2019/july/what-is-quantitative-tightening
3.2 The Asymmetric Effects Argument
St. Louis Fed President Jim Bullard argued in 2019 that the financial and macroeconomic effects of QE and QT may be asymmetric. The size of the balance sheet may have mattered while it was increasing, but not necessarily while it was decreasing. QE provided a credible signal when the policy rate was near zero; once rates were above zero, the signaling value of balance sheet changes dissipated.
Federal Reserve Bank of St. Louis — https://www.stlouisfed.org/open-vault/2019/july/what-is-quantitative-tightening
3.3 Asset Prices and Market Impact
Whereas QE contributed to substantial rises in asset prices over the past decade, QT may produce broadly offsetting effects — though the magnitude and timing remain uncertain. Notably, the conclusion of the most recent QT program was largely uneventful for broader markets.
PIMCO described the experience: unlike in 2019, when money market volatility prompted the Fed to halt QT abruptly, markets "barely seemed to notice" the end of the latest round. As former Fed Chair Janet Yellen described the intended effect of QT in 2017, it was meant to run quietly in the background, "like watching paint dry."
Part 4. QT and the Fed's Balance Sheet: How Far Can It Go?
4.1 The Ample Reserves Regime
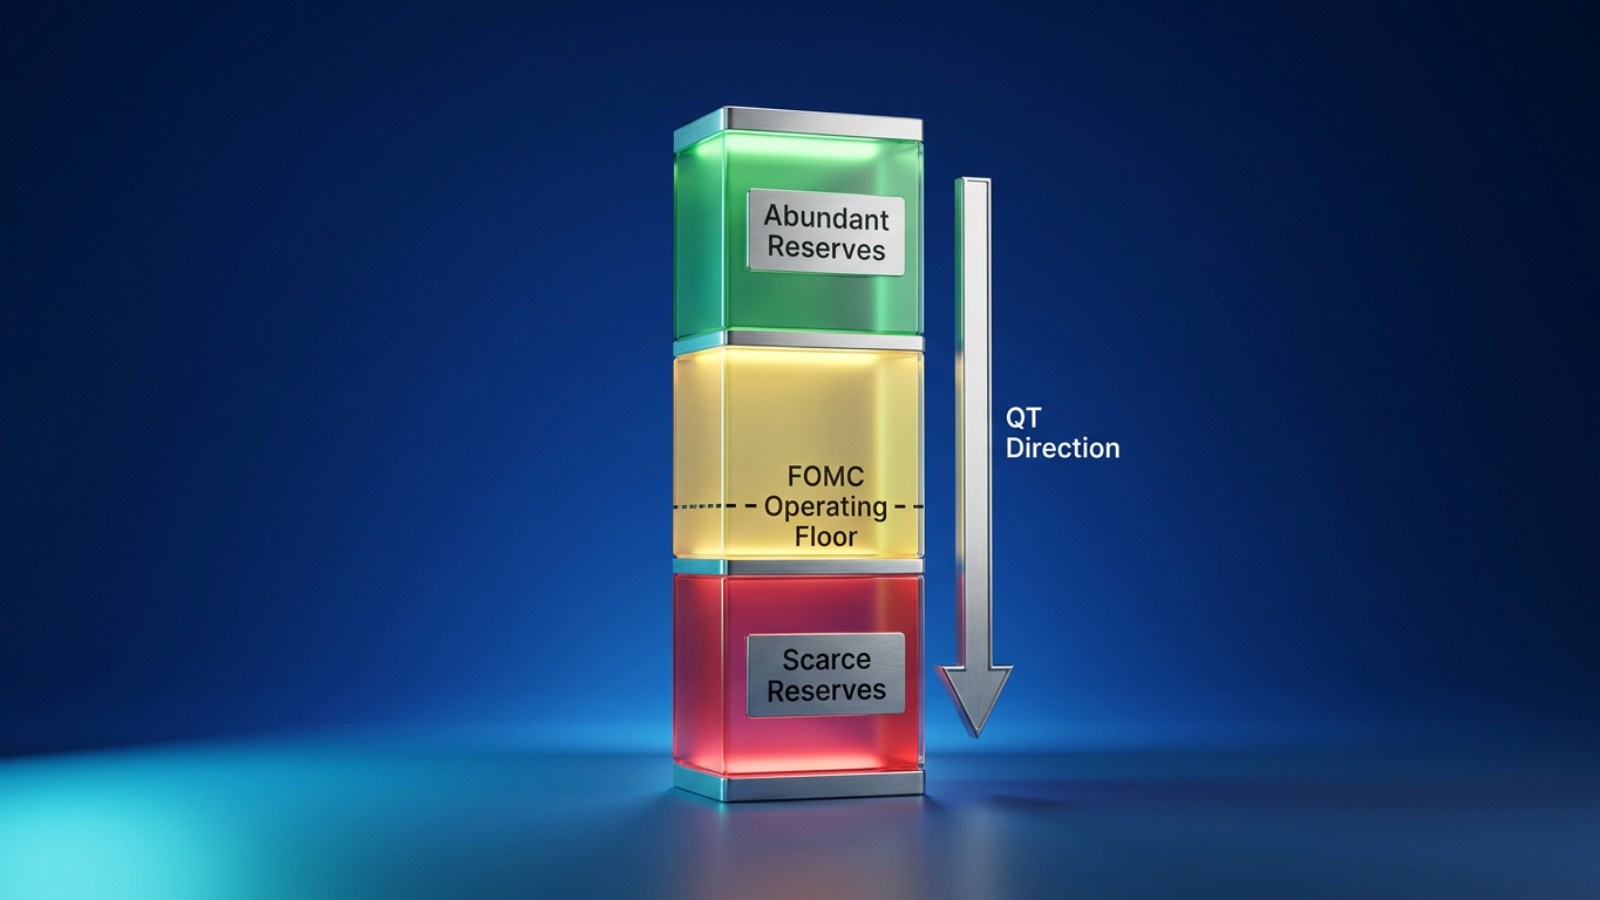
Since 2008, the Federal Reserve has operated under what is called the "ample reserves regime." In this framework, the FOMC influences market interest rates not by adjusting the supply of reserves directly, but by changing administered interest rates — such as the interest rate on reserve balances (IORB) and the overnight reverse repurchase agreement (ONRRP) rate.
Federal Reserve Bank of Cleveland — https://www.clevelandfed.org/publications/economic-commentary/2025/ec-202505-qt-ample-reserves-changing-fed-balance-sheet
This regime only works if reserves remain sufficiently large — or "ample" — so that small shifts in supply and demand for reserves don't move interest rates. The FOMC formally adopted this framework in January 2019 and reaffirmed it in January 2022.
Federal Reserve Bank of Cleveland — https://www.clevelandfed.org/publications/economic-commentary/2025/ec-202505-qt-ample-reserves-changing-fed-balance-sheet
4.2 Limits to QT: Reserve Scarcity
As QT reduces reserves from "abundant" to "ample" and potentially to "scarce" levels, the Fed faces a hard constraint. The FOMC has explicitly committed to staying in an ample reserves operating framework, which means QT cannot proceed past the point where reserves become scarce. Estimates of where that threshold lies vary widely.
The Federal Reserve Bank of New York has used reserves of between 8% and 10% of GDP as an indication of "ample." Other research has estimated the scarcity threshold at anywhere from 7% of GDP to more than 13% — equivalent to roughly $2 trillion to $3.8 trillion based on 2024 GDP levels.
Federal Reserve Bank of Cleveland — https://www.clevelandfed.org/publications/economic-commentary/2025/ec-202505-qt-ample-reserves-changing-fed-balance-sheet
4.3 The Role of the TGA and ONRRP
Two key Fed liabilities complicate the picture. The Treasury General Account (TGA) — the US Treasury's account at the Fed — can shift dramatically, moving money in and out of bank reserves. Over the past five years, the TGA has reached as high as $1.79 trillion and as low as $49 billion, with average weekly changes of $54 billion.
The overnight reverse repo program (ONRRP) allows the Fed to temporarily lend securities, also reducing reserves. As the ONRRP balance declines, the rolloff of securities begins to shrink bank reserves more directly.
Federal Reserve Bank of Cleveland — https://www.clevelandfed.org/publications/economic-commentary/2025/ec-202505-qt-ample-reserves-changing-fed-balance-sheet
4.4 Could QT Restart?
PIMCO analysts noted in 2026 that some Fed officials and academics have advocated for further balance sheet reduction, partly because post-crisis bank regulations have led to ever-larger demand for reserves. Research co-authored by Fed Governor Stephen Miran and other Fed economists quantified strategies that could reduce reserve demand by an additional $1–$2 trillion over time.
PIMCO believes the groundwork is already being laid to potentially restart a gradual QT process. If implemented gradually and with continued monitoring, the implications for broader markets "will also be similar to the recent experience — negligible."
Part 5. What QT Means for US Investors and How to Stay Informed on Webull
5.1 Why QT Matters to Individual Investors
QT affects the broader investment environment in several ways. Rising interest rates during QT periods can compress valuations for growth stocks, widen corporate bond spreads, and reduce the appeal of longer-duration assets relative to shorter-term instruments. While QT's direct economic impact may be more limited than QE's, its interaction with inflation expectations, credit conditions, and investor sentiment still warrants attention.
Investors who understand how monetary policy cycles unfold are better positioned to assess portfolio risk and evaluate individual securities in context.
5.2 Monitoring Macro Conditions Through Market Research
Staying informed during periods of monetary policy change requires access to timely, reliable data. Webull provides US investors with a range of research and analysis tools designed to help them track economic developments and assess individual securities.
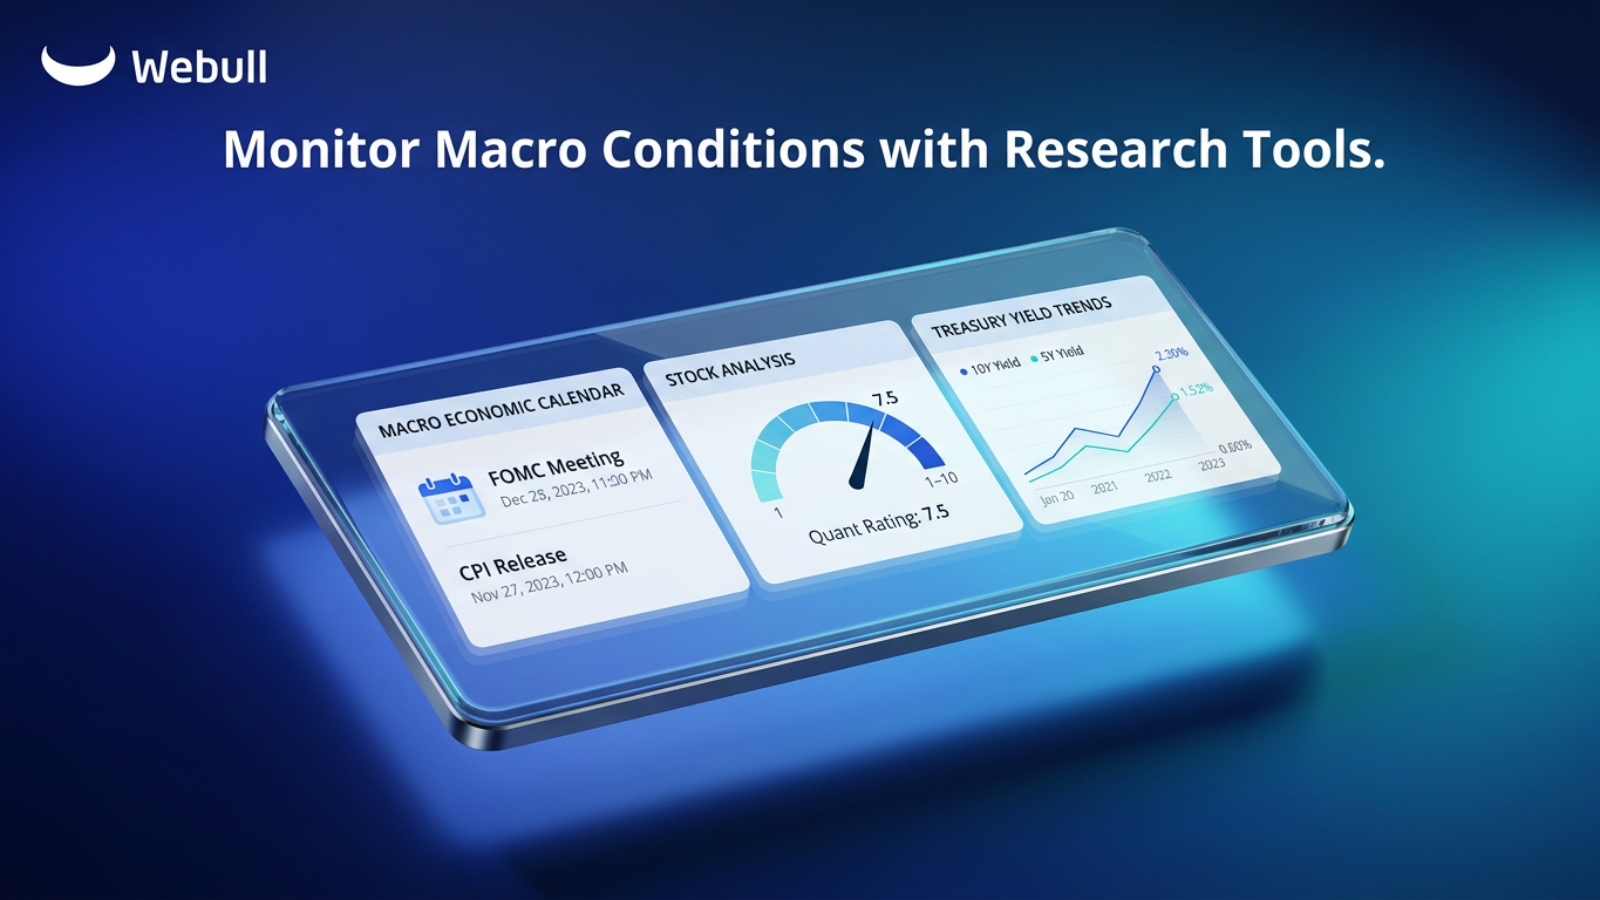
Webull's platform includes access to economic calendars, real-time market data, and news feeds — enabling investors to monitor FOMC announcements, Fed balance sheet updates, and macroeconomic releases such as CPI and employment data as they happen.
5.3 Webull's Quant Rating: A Framework for Evaluating Stocks in Any Rate Environment
One of Webull's more distinctive research features is the TC Quantamental Rating, available through Webull's stock analysis tools. This rating provides compact scores to evaluate a stock across five categories: Growth, Value, Income, Quality, and Momentum.
Each category draws on a specific set of fundamental indicators. For example:
Growth includes Price/Earnings Change (YOY) and EPS Growth (Last Quarter vs. Prior Year)
Value includes Earning Yield (EPS/Price per Share), EV/EBITDA, Price/Book Ratio, and Price/Free Cash Flow Ratio
Income includes Dividend Yield, Dividend Growth Rate, and Dividend Payout Ratio
Quality includes Operating Margin, Return on Equity (ROE), Return on Invested Capital (ROIC), and Total Debt/Equity Ratio Change
Momentum includes 3-Month and 12-Month Risk-Adjusted Momentum scores
The overall Quant Rating is an average score ranging from 1 to 10. A higher score indicates stronger overall company fundamentals. During QT cycles, when credit conditions tighten, Quality and Value metrics may carry particular relevance for investors seeking to assess a company's resilience.
5.4 Using Webull's Tools to Navigate a Shifting Rate Environment
Beyond the Quant Rating, Webull offers investors access to options trading and margin accounts, both of which can serve different strategies depending on an investor's risk tolerance and outlook during monetary policy transitions.
Rates vary by service provider; please refer to the latest pricing.
It is important to note that all investing involves risk, and individual securities may perform differently from broader market trends. Past market performance during prior QT cycles does not guarantee similar outcomes in future periods.
5.5 Staying Disciplined During Monetary Policy Shifts
During any QT cycle, market volatility may increase as liquidity is withdrawn and interest rate expectations shift. Investors may benefit from:
Reviewing the duration and interest-rate sensitivity of fixed-income holdings
Reassessing valuation assumptions for growth-oriented equities
Monitoring Fed communications, including FOMC meeting minutes and press conferences
Using fundamental screening tools — such as Webull's Quant Ratings — to identify companies with strong Quality and Value scores
Maintaining a diversified portfolio aligned with individual risk tolerance and investment objectives
None of the above constitutes personalized investment advice. Investors are encouraged to consult a qualified financial professional before making investment decisions.
The Bottom Line
Quantitative tightening is a measured, deliberate tool the Federal Reserve uses to normalize its balance sheet and manage inflation. While its economic effects appear more modest than QE's, QT still shapes interest rates, liquidity, and market conditions over time. US investors who stay informed — using platforms like Webull — can better understand how macro policy shifts may affect their portfolios.
Disclosure
Webull Financial LLC (member SIPC, FINRA) offers self-directed securities trading. All investments involve risk. More info: https://www.webull.com/policy
The information provided does not constitute investment advice and it should not be relied on as such. It should not be considered a solicitation to buy or an offer to sell a security. It does not take into account any investor's particular investment objectives, strategies, tax status or investment horizon. Investing involves risk, including the risk of loss of principal.
