'%3e %3cpath d='M41.7832962%2c0 C41.9459106%2c0 42.0882746%2c0.0866854658 42.1666825%2c0.216359069 C43.8289923%2c2.66540836 44.7676281%2c5.46271319 44.7676281%2c8.43208061 C44.7676281%2c18.1345746 34.7460532%2c26 22.383814%2c26 C10.0215749%2c26 0%2c18.1345746 0%2c8.43208061 C0%2c5.46716016 0.935826425%2c2.67378733 2.58829888%2c0.223985685 C2.67109477%2c0.0916264068 2.81687473%2c0 2.9840593%2c0 C3.23130408%2c0 3.43173558%2c0.200393004 3.43173558%2c0.447590303 C3.43173558%2c0.475056669 3.42926112%2c0.501945205 3.42452292%2c0.528045226 L3.41810883%2c0.550292077 C3.37800671%2c0.861741908 3.3575721%2c1.17661276 3.3575721%2c1.49443092 C3.3575721%2c7.98336 11.2132389%2c12.5742305 22.383814%2c12.5742305 C33.5543891%2c12.5742305 41.410056%2c7.98336 41.410056%2c1.49443092 C41.410056%2c1.17865223 41.3898828%2c0.865783153 41.3502888%2c0.556288325 C41.3402868%2c0.521941442 41.3356199%2c0.48531078 41.3356199%2c0.447590303 C41.3356199%2c0.200393004 41.5360514%2c0 41.7832962%2c0 Z' id='logo%e5%a4%87%e4%bb%bd-6' fill='white'%3e%3c/path%3e %3cpath d='M74.6899231%2c3.74404927 C75.2411227%2c3.74404927 75.7734299%2c3.66184338 76.2756219%2c3.50883715 L73.8159676%2c20.8666902 C73.5770593%2c22.5662954 72.8072434%2c23.0518969 71.4268838%2c23.0518969 L69.9934336%2c23.0518969 C68.7988917%2c23.0518969 68.1618027%2c22.458384 67.7901674%2c20.893668 L65.6930827%2c11.9909739 C65.639992%2c11.7481731 65.639992%2c11.6942174 65.5338105%2c11.6942174 C65.427629%2c11.6942174 65.4010836%2c11.7481731 65.3479929%2c11.9909739 L63.2509082%2c20.893668 C62.8792729%2c22.458384 62.2421839%2c23.0518969 61.047642%2c23.0518969 L59.6141918%2c23.0518969 C58.2338322%2c23.0518969 57.4640163%2c22.5662954 57.225108%2c20.8666902 L54.7463723%2c3.37406084 C55.3593498%2c3.61307396 56.0249975%2c3.74404927 56.7207458%2c3.74404927 C57.3314263%2c3.74404927 57.918917%2c3.64314414 58.4679557%2c3.4568446 L60.3574623%2c19.3829078 C60.3840076%2c19.6257086 60.3840076%2c19.7875757 60.4901891%2c19.7875757 C60.5963706%2c19.7875757 60.5963706%2c19.6257086 60.6494614%2c19.3829078 L62.9323637%2c9.91367858 C63.0916359%2c9.26620991 63.4632712%2c8.69967483 64.6047223%2c8.69967483 L66.4363532%2c8.69967483 C67.5778044%2c8.69967483 67.9494397%2c9.26620991 68.1087119%2c9.91367858 L70.3916142%2c19.3829078 C70.4447049%2c19.6257086 70.4447049%2c19.7875757 70.5508864%2c19.7875757 C70.6570679%2c19.7875757 70.6570679%2c19.6257086 70.6836133%2c19.3829078 L72.5891207%2c3.32292288 C73.2365902%2c3.59432921 73.9460524%2c3.74404927 74.6899231%2c3.74404927 Z' id='Combined-Shape' fill='white'%3e%3c/path%3e %3cpath d='M84.5933901%2c7.43171536 C88.6813779%2c7.43171536 90.9111894%2c10.2643908 90.9111894%2c14.2840921 L90.9111894%2c15.7948523 C90.9111894%2c16.2264981 90.7519172%2c16.4692988 90.3802819%2c16.4692988 L81.7264895%2c16.4692988 L81.7264895%2c16.5502324 C81.7264895%2c18.1149484 82.3635785%2c19.9764208 84.9119346%2c19.9764208 C86.849747%2c19.9764208 88.6813779%2c19.8145536 89.7962837%2c19.7066422 L89.8759198%2c19.7066422 C90.1413735%2c19.7066422 90.3537366%2c19.8415315 90.3537366%2c20.1113101 L90.3537366%2c21.8918489 C90.3537366%2c22.3234947 90.2741004%2c22.5123397 89.7962837%2c22.5932733 C88.0708343%2c22.9170076 87.0355646%2c23.0518969 84.6464808%2c23.0518969 C81.9919433%2c23.0518969 78.2225%2c21.5950924 78.2225%2c16.2804538 L78.2225%2c14.2840921 C78.2225%2c10.0755457 80.5319476%2c7.43171536 84.5933901%2c7.43171536 Z M84.5933901%2c10.5071915 C82.9475768%2c10.5071915 81.7530349%2c11.6942174 81.7530349%2c13.8254684 L81.7530349%2c13.9333799 L87.3806545%2c13.9333799 L87.3806545%2c13.8254684 C87.3806545%2c11.7211953 86.2392034%2c10.5071915 84.5933901%2c10.5071915 Z' id='Combined-Shape' fill='white'%3e%3c/path%3e %3cpath d='M97.4154906%2c2.98826245 L97.4148064%2c7.62056039 C98.3969853%2c7.48567108 99.3260735%2c7.43171536 99.9631625%2c7.43171536 C104.236968%2c7.43171536 106.307507%2c9.99461216 106.307507%2c14.2031585 L106.307507%2c16.2804538 C106.307507%2c20.4890001 104.236968%2c23.0518969 99.9631625%2c23.0518969 C98.2642584%2c23.0518969 96.2733553%2c22.7821183 94.627542%2c22.3504725 C94.0169984%2c22.1886054 93.9108169%2c22.0267382 93.9108169%2c21.6220703 L93.9098179%2c3.08694115 C94.4185466%2c3.24434375 94.9584615%2c3.32900525 95.5178331%2c3.32900525 C96.184659%2c3.32900525 96.8238351%2c3.20869291 97.4154906%2c2.98826245 Z M99.9631625%2c10.3453244 C99.3260735%2c10.3453244 98.1580769%2c10.4262579 97.4148064%2c10.5341694 L97.4148064%2c19.9494429 C97.9191686%2c20.0573544 99.007529%2c20.1382879 99.9631625%2c20.1382879 C102.246065%2c20.1382879 102.803518%2c18.4926384 102.803518%2c16.2804538 L102.803518%2c14.2031585 C102.803518%2c11.9909739 102.246065%2c10.3453244 99.9631625%2c10.3453244 Z' id='Combined-Shape' fill='white'%3e%3c/path%3e %3cpath d='M111.036668%2c8.72457747 C111.579488%2c8.72457747 112.103987%2c8.64485191 112.599444%2c8.49629404 L112.598761%2c16.5232546 C112.598761%2c19.3289521 113.607485%2c19.9764208 115.147117%2c19.9764208 L115.306389%2c19.9764208 C116.846021%2c19.9764208 117.854746%2c19.3289521 117.854746%2c16.5232546 L117.854207%2c8.4334735 C118.406525%2c8.62226395 118.997939%2c8.72457747 119.612866%2c8.72457747 C120.223332%2c8.72457747 120.810625%2c8.62374317 121.359498%2c8.43756894 L121.358735%2c16.5232546 C121.358735%2c22.4044283 116.872567%2c23.0518969 115.306389%2c23.0518969 L115.060464%2c23.0512514 C113.42215%2c23.0271041 109.094772%2c22.2994073 109.094772%2c16.5232546 L109.094446%2c8.36700801 C109.698522%2c8.59813531 110.353066%2c8.72457747 111.036668%2c8.72457747 Z' id='Combined-Shape' fill='white'%3e%3c/path%3e %3cpath d='M128.314162%2c3.03790128 L128.313623%2c22.269539 C128.313623%2c22.5662954 128.10126%2c22.836074 127.809261%2c22.836074 L125.340541%2c22.836074 C125.048542%2c22.836074 124.809634%2c22.5662954 124.809634%2c22.269539 L124.809455%2c3.04219481 C125.358161%2c3.22824247 125.945253%2c3.32900525 126.555503%2c3.32900525 C127.17043%2c3.32900525 127.761844%2c3.22669173 128.314162%2c3.03790128 Z' id='Combined-Shape' fill='white'%3e%3c/path%3e %3cpath d='M133.90653%2c3.32900525 C134.473329%2c3.32900525 135.02015%2c3.24208064 135.534793%2c3.08063296 L135.533966%2c22.269539 C135.533966%2c22.5662954 135.321603%2c22.836074 135.029603%2c22.836074 L132.560884%2c22.836074 C132.268884%2c22.836074 132.029976%2c22.5662954 132.029976%2c22.269539 L132.029909%2c2.99605058 C132.615669%2c3.21152525 133.2476%2c3.32900525 133.90653%2c3.32900525 Z' id='Combined-Shape' fill='white'%3e%3c/path%3e %3c/g%3e %3c/g%3e %3c/g%3e%3c/svg%3e)



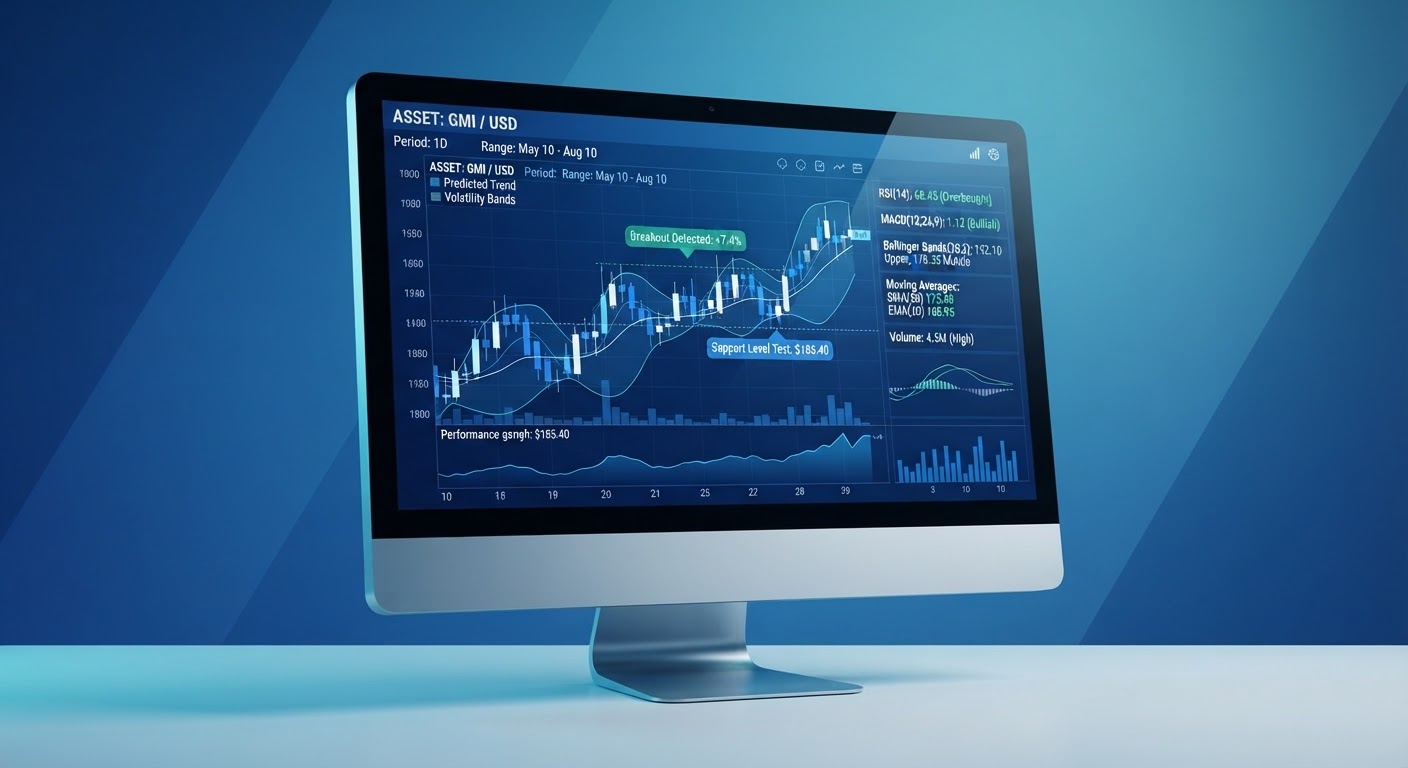
AI chart analysis uses machine learning and pattern-recognition algorithms to scan price charts, identify technical setups, and surface momentum or trend signals in seconds rather than hours. For traders researching an AI-powered stock chart analyzer for the first time, understanding how these tools work — and their limits — is the first step toward using them responsibly alongside traditional research.
Key Takeaways
AI chart analysis applies pattern-recognition algorithms to price, volume, and momentum data to flag technical setups faster than manual review.
Industry data suggests 60–73% of U.S. equity trading volume is now algorithmic, reflecting how widely automated analysis tools are already used.
AI tools can scan 45+ chart patterns across multiple timeframes, but outputs are statistical observations, not predictions or guarantees of future price movement.
Platforms differ by focus: some emphasize automated pattern recognition (e.g., TrendSpider), others emphasize modular, on-demand AI research reports (e.g., Webull's Vega Analyst).
Investing involves risk, including possible loss of principal. AI-generated chart analysis is informational and educational — not personalized investment advice.
Part 1. What Is AI Chart Analysis and How Does It Work?
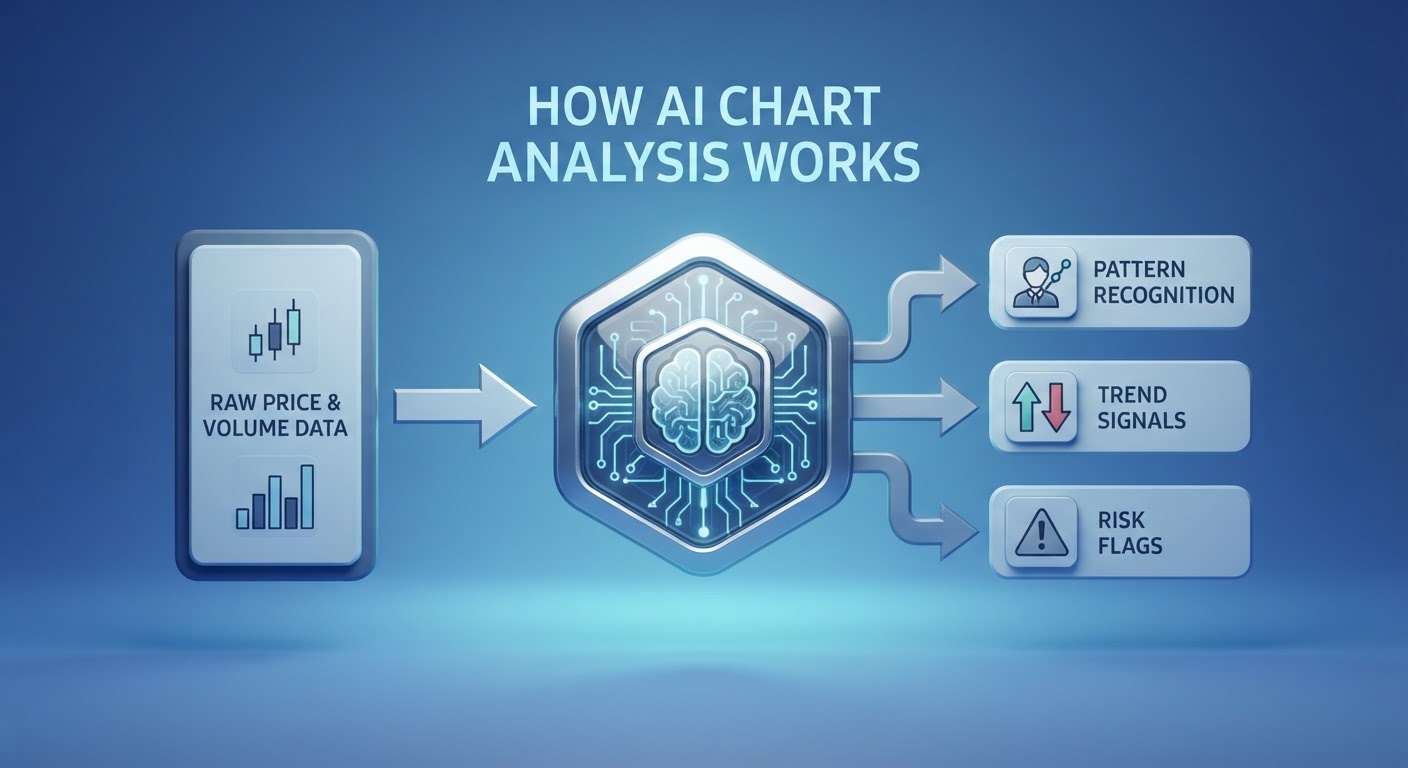
AI chart analysis refers to software that applies machine learning models to historical and real-time price data to detect recurring chart patterns — such as trendlines, support and resistance zones, moving average crossovers, and momentum divergences — and present them in a readable format for traders. Rather than a trader manually drawing trendlines or calculating indicator values on dozens of charts, an AI system can process the same information across thousands of securities simultaneously.
According to a 2026 industry overview from Jenova AI, an AI Technical Analysis Stock Agent is designed to "analyze price charts, identify technical patterns, interpret volume and momentum indicators, and provide actionable trading insights — augmenting human decision-making with machine-speed pattern recognition and multi-timeframe analysis". The same source notes that AI-powered pattern-recognition systems can identify over 45 different chart patterns in real time, a scale that would be impractical to replicate manually across a broad watchlist.
1.1 Core Components of AI Chart Analysis Tools
Most AI chart analysis platforms combine a few core functions:
Pattern recognition — identifying formations such as triangles, channels, head-and-shoulders, or flags across one or more timeframes.
Indicator interpretation — reading momentum and trend indicators (RSI, MACD, moving averages) in context rather than in isolation.
Multi-timeframe analysis — cross-referencing daily, weekly, and monthly charts to assess whether signals align.
Confluence scoring — some tools rate how many signals point in the same direction, which can help gauge the relative strength of a setup.
1.2 Why Manual Technical Analysis Has Limitations
Reading charts by hand is time-intensive and subject to human constraints. Research cited by Jenova AI notes that professionals can spend close to 60% of their time cleaning and organizing data, with roughly 19% spent gathering datasets — leaving comparatively little time for interpretation itself. Manual review is also inherently limited in scope (often covering only 10–20 names at a time) and can be influenced by emotional bias such as fear or greed, which may distort how a trader interprets an ambiguous chart pattern.
1.3 What AI Chart Analysis Cannot Do
It's important to set realistic expectations. As Jenova AI's free technical analysis resource explicitly states, this category of tool "cannot predict stock prices with certainty," "cannot guarantee profitable trades," and "cannot execute trades" on its own. Outputs are described as "technical observations and probabilities, not predictions." This distinction matters: AI chart analysis is a research aid, not a crystal ball, and past chart patterns do not guarantee future price behavior.
Part 2. AI-Powered Platforms and Tools for Chart and Stock Analysis
The market for AI-assisted chart and stock analysis includes a range of platforms, from dedicated technical-analysis software to AI research modules built directly into brokerage apps. This section reviews several notable examples for informational comparison purposes; feature sets, pricing, and focus areas vary by provider and can change over time, so readers should verify current details directly with each platform before making a decision.
2.1 Webull's Vega Analyst: Modular AI Research Reports
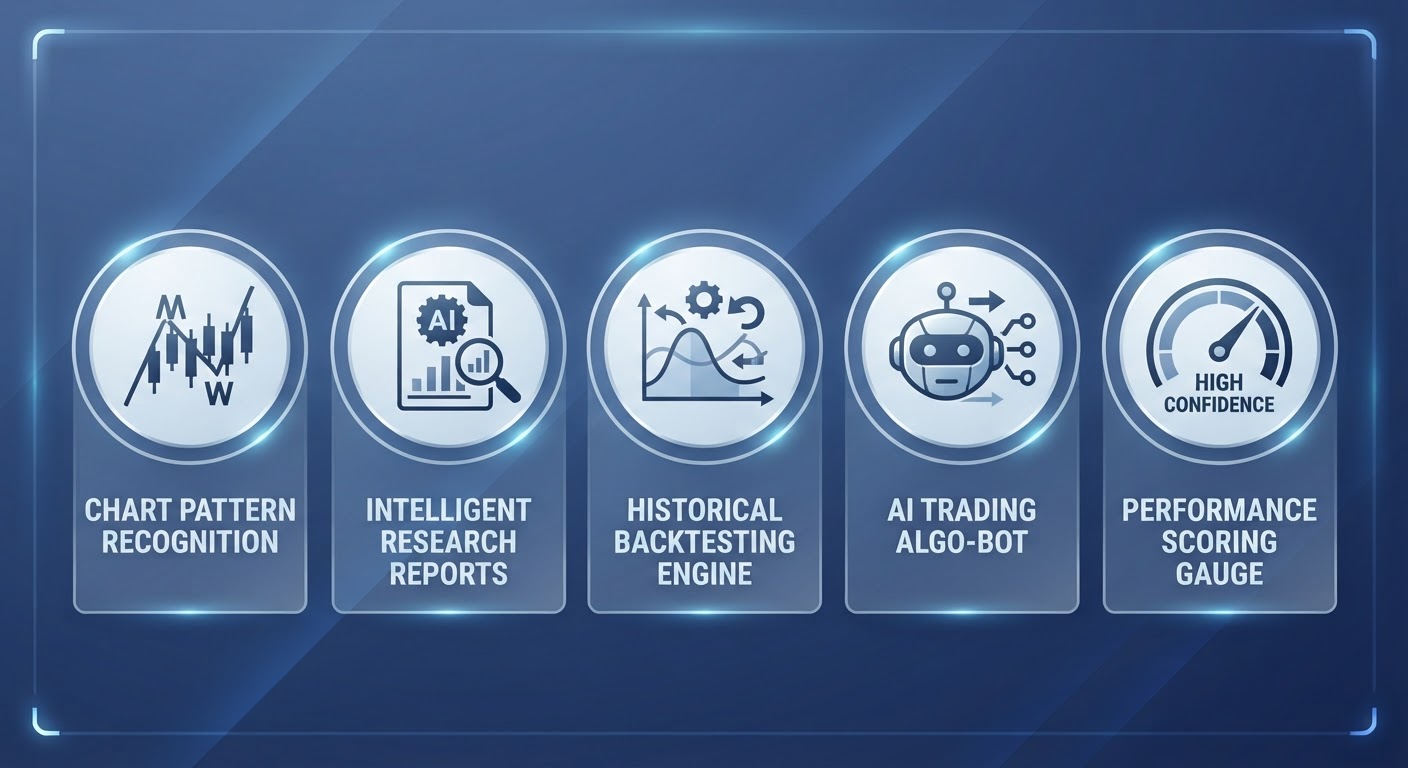
Among brokerage-integrated AI research tools, Webull's Vega Analyst stands out for its modular approach to generating on-demand stock reports. Rather than producing a single fixed template, Vega Analyst lets users choose from a set of research modules and builds a report based on those selections. According to Webull's internal documentation, the available modules include:
Company Overview — what the company does, how it generates revenue, and what drives the business.
Financial Analysis — revenue, margins, profitability, earnings quality, balance sheet strength, and operating performance.
Industry Analysis — competitive positioning, sector trends, and broader market outlook.
Valuation Analysis — whether the current price appears reasonable based on valuation measures, peer comparisons, and key assumptions.
Key Events — recent news, earnings, corporate actions, product updates, and regulatory developments that may affect the stock price.
Technical Analysis — price trends, momentum, support and resistance levels, chart structure, and trading signals.
Risk Alerts — major risks, downside scenarios, uncertainty factors, and reasons for caution.
This modular design allows a user researching a stock's chart pattern to select just the Technical Analysis module for a focused view, or to combine it with Financial Analysis and Risk Alerts for a broader picture. As Webull's documentation notes, "selecting more modules produces a more comprehensive report. Selecting fewer produces a more focused one" — meaning the appropriate approach depends on what the user is actually researching, not simply which option is described as "better."
Every Vega Analyst report is generated in real time rather than pulled from a pre-built template. Per Webull's FAQ, "reports use the latest data available at the time of generation," though market data and quotes may be delayed, so users are advised to "verify figures against real-time quotes before acting on any information." Each report also includes a Key Summary, Modular Analysis sections corresponding to the chosen modules, Traceable Data intended to make figures easier to verify, and a Risks and Opportunities section that appears regardless of which modules were selected — a structure that reflects a balanced presentation of both upside factors and potential concerns.
Webull's documentation is explicit that Vega Analyst content "is for informational reference only and does not constitute investment advice," and that "investing involves risk" — a disclosure that applies broadly to AI-generated financial research across the industry, not just to this one feature.
2.1.1 How Vega Analyst Credits Work
Vega Analyst uses a credit-based system tied to subscription tier:
Detail | Description |
|---|---|
Free user allocation | 80 credits per month |
Credit rollover | Unused credits do not carry over between cycles |
Report cost driver | Number of modules selected per report |
Standard mode estimate | Approximately 23 reports per standard credit allocation (3–4 modules) |
Report history (subscribers) | Saved permanently; viewing does not consume credits |
Report history (free users) | Retained for 7 days |
Webull's own FAQ clarifies that the "approximately 23 reports" figure is only an estimate based on Standard mode usage, and that "actual report count will vary based on module selection," with the in-app credit balance serving as "the definitive measure." Credits are described as non-transferable, non-refundable, non-shareable, and holding no monetary value — details worth understanding before relying heavily on a paid tier.
2.1.2 Choosing the Right Module Combination
Because module selection directly affects both report depth and credit cost, Webull's documentation recommends a targeted approach: "the recommended approach is to select only the modules relevant to the specific analysis being conducted." For a trader focused specifically on chart-based decisions, pairing the Technical Analysis module with Risk Alerts may offer a more efficient use of credits than selecting all seven modules for every ticker reviewed.
2.2 TrendSpider: Automated Pattern Recognition and Custom Indicators
TrendSpider is a platform built around automated technical analysis, combining pattern recognition with machine learning tools. According to TrendSpider's own site, its automated analysis "identifies chart patterns, trendlines, and Fibonacci levels with mathematical precision" and includes multi-timeframe analysis supported by more than 200 built-in indicators. The platform also offers an AI assistant, described as capable of reviewing charts, reading SEC filings, and building custom scanners from natural-language prompts, along with an ML Strategy Lab for building and backtesting predictive models without requiring coding experience.
2.3 Other AI Stock and Chart Analysis Tools
Several other platforms take different approaches to AI-assisted analysis:
Trade Ideas centers on its Holly AI agent, which runs nightly backtests across thousands of stocks and suggests stop-loss and take-profit levels, with plans starting from $127/month according to WallStreetZen's 2026 review.
Tickeron combines AI pattern recognition with a marketplace of automated trading bots, offering a free plan alongside paid tiers starting around $60/month.
Zen Ratings, reviewed by WallStreetZen, evaluates 115 factors through a neural network trained on 20 years of data, with a free plan and a $1 two-week premium trial.
DanelFin assigns an AI Score (1–10) to more than 5,500 U.S. and European stocks based on the probability of outperforming the market over three months.
Robinhood Cortex, included with Robinhood Gold, uses generative AI to summarize news and build custom indicators via natural-language prompts, though WallStreetZen notes it "lacks deep quant ratings or multi-factor analysis found in dedicated platforms."
Trade AI (App Store) lets users upload a screenshot of any chart for AI-generated pattern and indicator analysis, with a disclaimer that it "does not provide financial or investment advice."
2.4 Comparing AI Chart and Stock Analysis Platforms
Platform | Primary Focus | Notable Feature |
|---|---|---|
Webull Vega Analyst | Modular AI research reports (7 modules incl. Technical Analysis) | Select only relevant modules; real-time report generation |
TrendSpider | Automated pattern & trendline detection | 200+ indicators, ML Strategy Lab |
Trade Ideas | Momentum alerts & backtesting | Holly AI nightly backtests |
Tickeron | Pattern recognition + trading bots | Bot marketplace |
Zen Ratings | Multi-factor stock ratings | 115-factor neural network |
DanelFin | AI probability scoring | AI Score for 5,500+ stocks |
Pricing and features reported are based on publicly available information cited in sources above as of the dates noted and may change; readers should confirm current terms directly with each provider.
Part 3. Step-by-Step: How to Use an AI Chart Analyzer for Stock Research
Understanding the general workflow of AI chart analysis tools can help traders use them more effectively as part of a broader research process.
3.1 A Typical Workflow
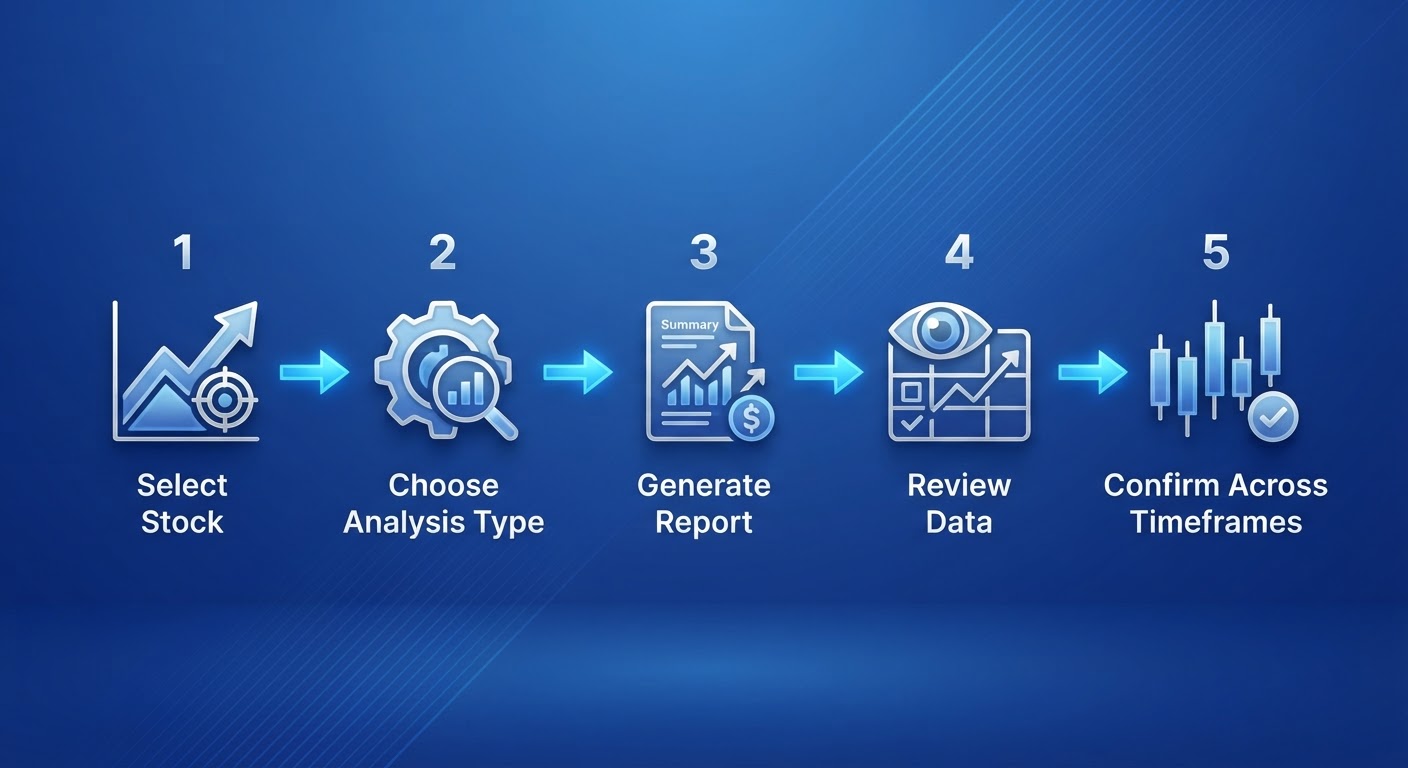
Select a security and timeframe. Choose the stock, ETF, or other instrument and decide whether you're focused on a short-term (daily/hourly) or longer-term (weekly/monthly) view.
Choose the type of analysis needed. Some platforms, like Webull's Vega Analyst, let users pick specific modules (e.g., Technical Analysis plus Risk Alerts) rather than generating a one-size-fits-all report.
Generate the report or scan. The AI system processes available price, volume, and — depending on the tool — fundamental or news data, and returns pattern identifications, indicator readings, or a written summary.
Review the supporting data. Look for traceable data points and context rather than accepting a conclusion at face value; Webull's documentation specifically highlights "Traceable Data" as a report component designed "to make the report easier to verify."
Cross-check across timeframes. Jenova AI's best-practice guidance recommends verifying "AI-identified patterns across multiple timeframes" rather than relying on a single chart view.
Weigh risks alongside opportunities. A balanced report should surface both — Webull notes that its Risk Alerts—style content appears "regardless of module selection."
Maintain human judgment for the final decision. Industry sources are consistent on this point: AI can process volume and recognize patterns, but "humans excel at strategic judgment, context interpretation, risk assessment, final decision-making" (jenova.ai, 2026).
3.2 Common Mistakes to Avoid
Treating AI output as a guarantee. All cited platforms describe their outputs as observations, scores, or probabilities — not certainties.
Selecting more analysis modules than necessary. Webull's own guidance notes that selecting modules "not relevant to the question being investigated adds cost without adding useful information."
Ignoring data delays. Because market data and quotes "may be delayed," per Webull's FAQ, it's worth confirming real-time prices before acting on any AI-generated figure.
Relying on a single timeframe. Multi-timeframe confirmation is a recurring theme across the AI technical analysis sources reviewed here.
Part 4. Benefits and Limitations of AI Chart Analysis
A balanced view of AI chart analysis requires looking at both what it can add to a research process and where its limits lie.
4.1 Potential Benefits
Speed: AI tools can scan thousands of securities in the time it would take to manually review a handful of charts.
Breadth of coverage: Automated pattern recognition can be applied consistently across an entire watchlist rather than a small subset.
Consistency: Because the process is rules- and data-based, it is not subject to the fear or greed that can affect a trader's read of an ambiguous setup.
Multi-timeframe synthesis: Several tools reviewed above are designed to cross-check daily, weekly, and monthly signals simultaneously.
4.2 Key Limitations and Risks
No certainty of outcome. As Jenova AI states plainly, AI tools "cannot predict stock prices with certainty" and "cannot guarantee profitable trades."
Data quality dependence. Analysis is only as reliable as the underlying data; insufficient or delayed data can degrade output quality.
Overfitting risk. Some models may be tuned too closely to historical training data and may not perform as well under new or unusual market conditions.
Limited explainability. More complex AI models can be difficult to audit, sometimes described as a "black box" problem in industry commentary.
Not a substitute for human oversight. Every source reviewed for this article — from Jenova AI's best practices to Webull's own FAQ — emphasizes that AI-generated analysis should inform, not replace, a trader's own judgment.
4.3 Pros and Cons Summary
Pros
Processes large volumes of chart data quickly
Can apply consistent pattern-recognition criteria across many securities
Some platforms offer modular or customizable analysis depth
Reduces time spent on manual chart scanning
Cons
Outputs are probabilistic, not predictive or guaranteed
Quality depends on underlying data accuracy and timeliness
Some models may be difficult to interpret or audit
Should not replace fundamental analysis, risk management, or personal judgment
Part 5. Trust, Regulation, and Safety Considerations for AI-Assisted Trading Tools
Because AI chart analysis tools are often used alongside real trading decisions, understanding the regulatory and safety context of the brokerage or platform providing them is an important part of due diligence.
5.1 Brokerage Regulation Basics
When evaluating any brokerage that offers AI-powered research tools, it's reasonable to check:
Whether the broker-dealer is registered with the SEC and a member of FINRA.
Whether customer securities accounts are protected by SIPC (Securities Investor Protection Corporation), which covers certain losses if a brokerage fails — noting that SIPC protection does not cover investment losses due to market movement.
What fees apply beyond any advertised "$0 commission" claims, such as regulatory fees, margin interest, or other account-related costs, which should be disclosed in a broker's fee schedule.
5.2 Data and Platform Safety
Because AI research tools rely on continuous data feeds, it's worth understanding:
Whether reports are generated in real time or from cached/pre-built templates — for example, Webull's Vega Analyst generates each report on demand using the latest available data.
Whether market data used in a report may be delayed, and how to verify figures against live quotes.
How account and usage data (such as report history) is retained — for example, Webull's documentation notes subscriber reports are saved permanently while free-user reports are retained for a limited window.
5.3 Risk Disclosure
All investing involves risk, including the possible loss of principal. AI-generated chart analysis, scores, or reports — including those referenced in this article — are informational and educational tools. They do not constitute investment, tax, or legal advice, and past performance or historical pattern behavior does not guarantee future results. Before acting on any AI-generated insight, investors should consider verifying data independently and, where appropriate, consulting a qualified financial professional.

Frequently Asked Questions
Is AI chart analysis accurate?
AI chart analysis tools can identify patterns and indicator readings quickly and consistently, but accuracy varies by platform, data quality, and market conditions. Outputs are best understood as statistical observations rather than guaranteed predictions.
Can AI chart analysis replace a human trader or analyst?
No. Industry sources consistently describe AI as a complement to human decision-making rather than a replacement, with AI handling volume and pattern recognition while humans retain responsibility for context, risk assessment, and final decisions.
What is Webull's Vega Analyst and how is it different from a basic chart scanner?
Vega Analyst is Webull's AI research feature that generates modular, on-demand reports covering areas such as Technical Analysis, Financial Analysis, Valuation, and Risk Alerts. Users choose which modules to include, allowing the report to be tailored to a specific research question rather than relying on a single fixed output.
Do AI stock analysis tools cost money?
It depends on the platform. Many offer a free tier with usage limits and a paid subscription for expanded access.
Is data used in AI chart analysis reports real-time?
Reports are generally built using the latest available data at the time of generation, but market quotes may be delayed. It's advisable to verify key figures against real-time quotes before making any decision.
Are AI-generated stock reports considered investment advice?
No. Providers reviewed in this article, including Webull, explicitly state that AI-generated content is for informational or educational purposes only and does not constitute investment advice.
What should I check before trusting an AI chart analysis platform?
Consider the platform's data sources, whether reports are generated in real time, how transparent the underlying methodology is, and whether the provider (or its affiliated brokerage) is properly registered with regulators such as the SEC and FINRA.
The Bottom Line
AI chart analysis can help traders scan patterns and indicators faster than manual review, but it does not predict outcomes or replace human judgment. Tools like Webull's modular Vega Analyst reports let users tailor research depth to their needs. Explore available research tools, verify data independently, and remember that investing involves risk, including possible loss of principal.
Disclamer
Securities trading is offered to self-directed customers by Webull Financial LLC, member SIPC, FINRA. All investments involve risk, including the possible loss of principal. You should consider your investment objectives carefully before investing. This is not a recommendation, investment advice, or a solicitation for the purchase or sale of a security. Additional info: webull.com/disclosures
Disclosure
Webull Financial LLC, Member SIPC, FINRA. Investing involves risk. More info at webull.com/policy
