
Trading 0DTE Butterflies Off the Gamma Map: Two Trades From November 17
Tuesday's premarket gamma map pointed to a negative-gamma session in both the S&P 500 and the Nasdaq-100, the kind of day when dealer hedging tends to push price away from a level rather than pin it there. That read shaped two short-dated trades I placed after the open: a short put butterfly on NDX and another on SPX. Both were built around strikes the map had flagged, and both closed for a gain before 10:45 a.m. ET.
This is a walk-through of how the map was read and how it translated into structure, not a recommendation to repeat the trades.
What the 8:40 a.m. map showed
The map is built from Schwab option chains for same-day (0DTE) expirations, using prior-session open interest. It estimates where dealer hedging is likely to slow price down (walls), where the hedging regime changes (the gamma flip), and which strike carries the most gamma (the pin or magnet).
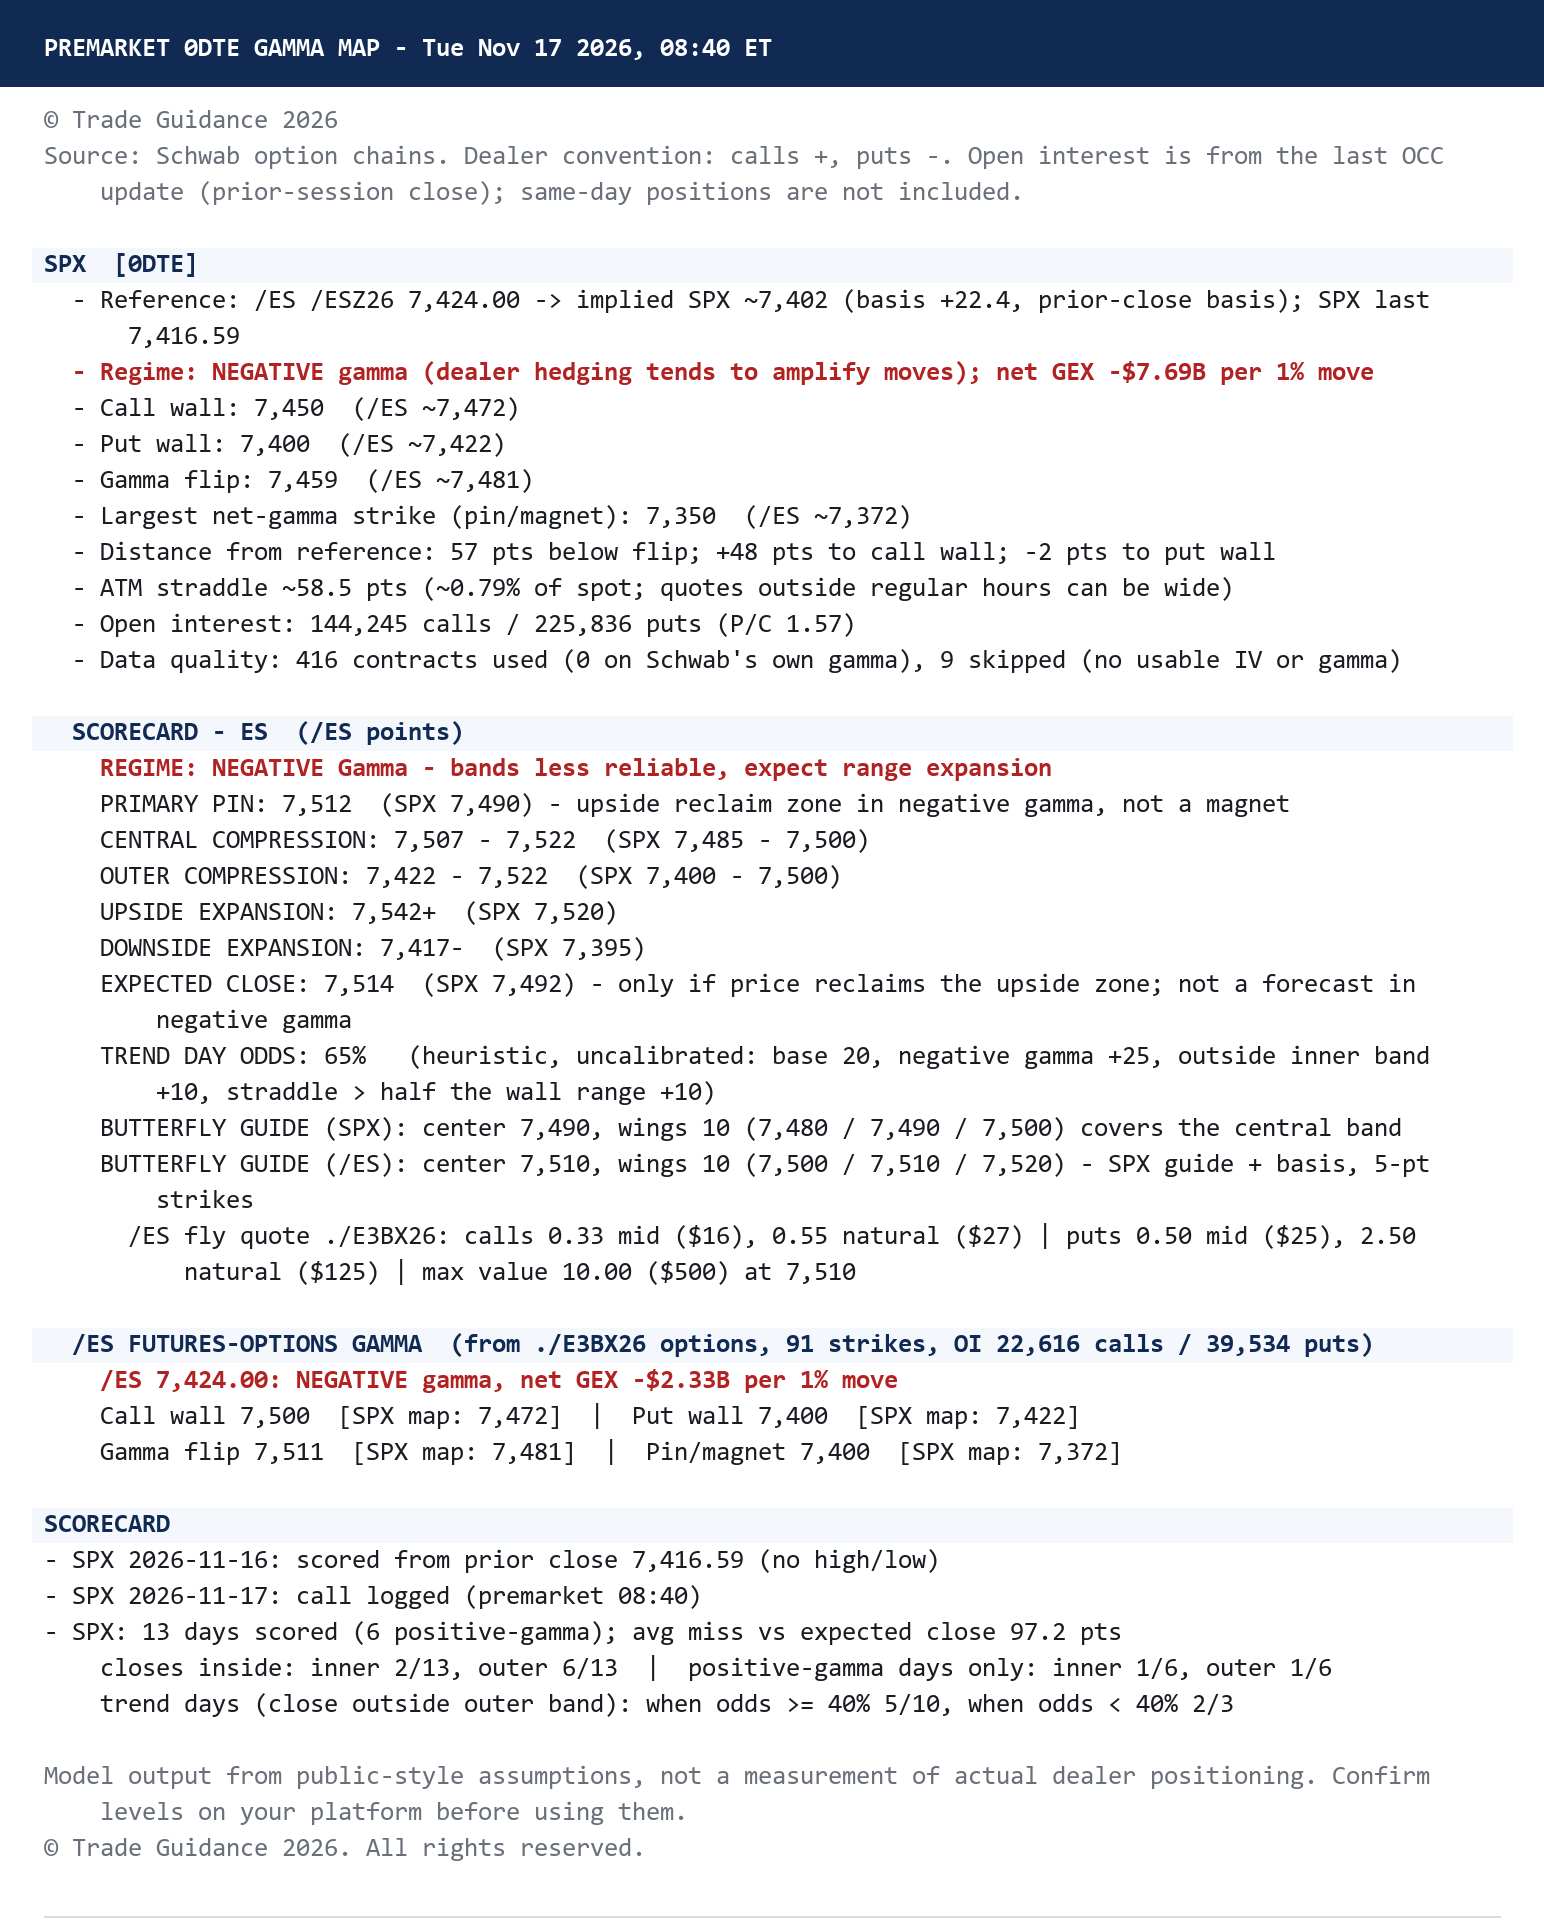
SPX: negative gamma, roughly -$7.7 billion per 1% move. The call wall sat at 7,450 and the put wall at 7,400, with the gamma flip at 7,459 and the largest net-gamma strike at 7,350. The at-the-money straddle priced about a 58-point move, and the map put trend-day odds at 65%.
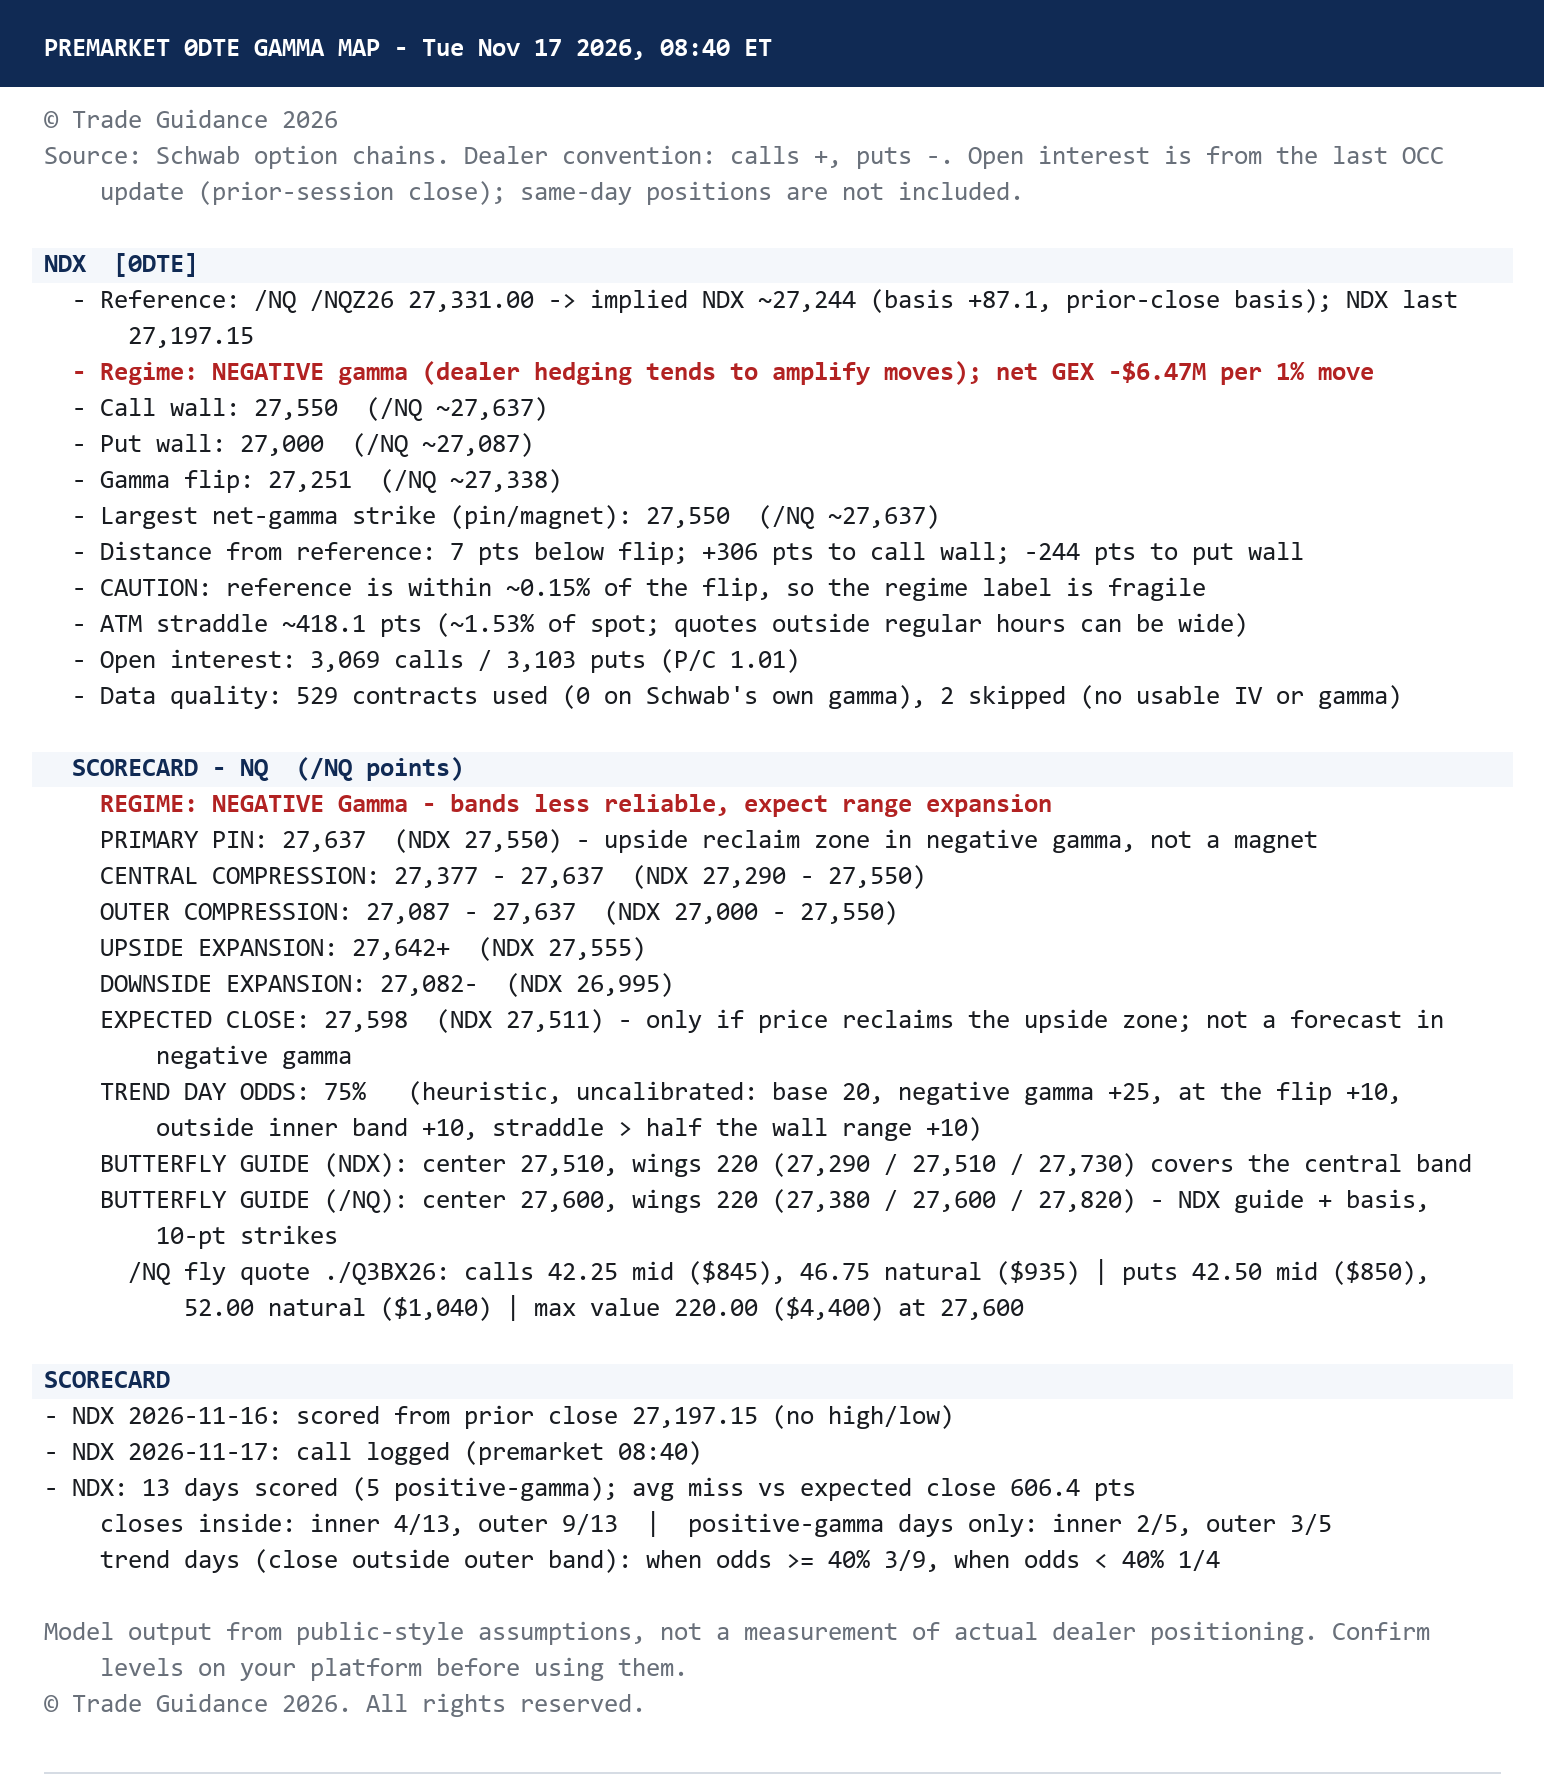
NDX: also negative gamma, with the reference price sitting within a few points of the 27,251 flip, which made the regime label fragile. The call wall and pin were both at 27,550 and the put wall at 27,000. The at-the-money straddle priced about 418 points, and trend-day odds came in at 75%.
In plain terms, both indexes were set up for range expansion. That favors structures that profit when price moves away from a strike, rather than ones that need price to settle on it.
Trade 1: NDX short put butterfly
A short put butterfly sells one put at each wing and buys two at the center strike, collecting a credit. It makes money when price moves away from the center toward either wing, which suits a negative-gamma read where a pin is unlikely to hold.
- Structure: sold the 27,150 put, bought two 27,550 puts, sold the 27,950 put (400 points wide), centered on the 27,550 call wall and pin.
- Entry: filled at 9:53 a.m. ET for a 110.00 net credit.
- Exit: filled at 9:56 a.m. ET for a 90.00 net debit.
- Result: 20 points captured, about $1,991 per butterfly after commissions, held for under three minutes.
The defined risk was the 400-point width minus the credit, or 290 points per butterfly. The 400-point wings were close to the 418-point straddle, so the structure roughly matched the move the options market was pricing.
Trade 2: SPX short put butterfly
- Structure: sold the 7,330 put, bought two 7,400 puts, sold the 7,470 put (70 points wide). The center sat on the 7,400 put wall. The lower wing was near the 7,350 magnet, and the upper wing just beyond the 7,450 call wall and 7,459 flip.
- Entry: filled at 9:43 a.m. ET for a 29.75 net credit.
- Exit: a 22.00 closing limit went in at 10:18 a.m. and filled at 10:41 a.m. ET.
- Result: 7.75 points captured, about $766 per butterfly after commissions, held for just under an hour.
Defined risk was 40.25 points per butterfly. The closing put prices were higher than at entry, showing SPX moved lower after the fill, away from the 7,400 center and toward the lower wing. That is the move a short fly needs.
What the map did, and what it didn't
The map didn't predict direction. It told me which kind of day to expect and which strikes the hedging flows were organized around. On a negative-gamma morning, the useful question is not "where will it pin?" but "where is it likely to leave?" Centering a short fly on a wall answers that question with a defined-risk position.
Both trades were taken off quickly. Short butterflies on 0DTE options can swing hard in either direction within minutes, and the credit collected is small next to the width at risk. Taking a modest gain early was a deliberate choice, not a missed opportunity.
The broader takeaway: let the gamma regime choose the structure, and let the walls choose the strikes.
The gamma map is model output based on public-style assumptions about dealer positioning, not a measurement of it. Results shown are the author's own trades from a single session and are not indicative of future results. Options on index products involve substantial risk, and 0DTE positions can lose much of their value quickly. This article is for educational purposes only and is not investment advice. The author may hold positions in the instruments discussed.