
Viking reports sales below analyst estimates in Q3 2026 earnings
Luxury cruise operator Viking (NYSE:VIK) missed Wall Street’s revenue expectations in Q3 2026, but revenue rose 9.2% year on year to $2.18 billion. Its non-GAAP profit of $1.11 per share was 12.1% below analysts’ consensus estimates.
For more on Viking, read our free full research report.
Viking Q3 2026 highlights:
- Revenue $2.18 billion vs S&P analysts’ consensus estimates of $2.20 billion (9.2% year-on-year growth, 0.9% miss)
- Adjusted EPS $1.11 vs S&P analysts’ consensus estimates of $1.26 (12.1% miss)
- Adjusted EBITDA $673.5 million vs analysts’ consensus estimates of $736.1 million (30.8% margin, 8.5% miss)
- Operating margin 26.1%, down from 30.2% in the same quarter last year
- Free cash flow margin 24.6%, down from 30.5% in the same quarter last year
- Market capitalization $40.32 billion
“We delivered strong third quarter revenue, supported by continued fleet expansion, the benefits of our diversified business model and growth in revenue per PCD,” said Leah Talactac, President and CEO of Viking. “While prolonged periods of historically low water levels disrupted portions of our European river operations during the quarter, our nearly 30 years of experience operating on Europe’s waterways allowed us to adapt to changing conditions and minimize the impact on our guests. We are proud of and thankful for our crew and shoreside teams for their extraordinary efforts during this period. Importantly, we remain encouraged by the resilience of demand across our diverse portfolio of products and the long-term appeal of the one Viking brand.”
Revenue growth
A company’s long-term performance is an indicator of its overall quality. Even a weak business can perform well for one or two quarters, but a high-quality one grows for years. Over the last three years, Viking grew its revenue at a 22.5% compounded annual growth rate. Though this growth is acceptable on an absolute basis, more than just revenue growth is needed to assess the consumer discretionary sector, which can display significant earnings volatility. This means the bar for the sector is particularly high, reflecting the non-essential and hit-driven nature of the products and services offered. Additionally, the five-year compounded annual growth rate starts around Covid, when revenue was depressed before rebounding.
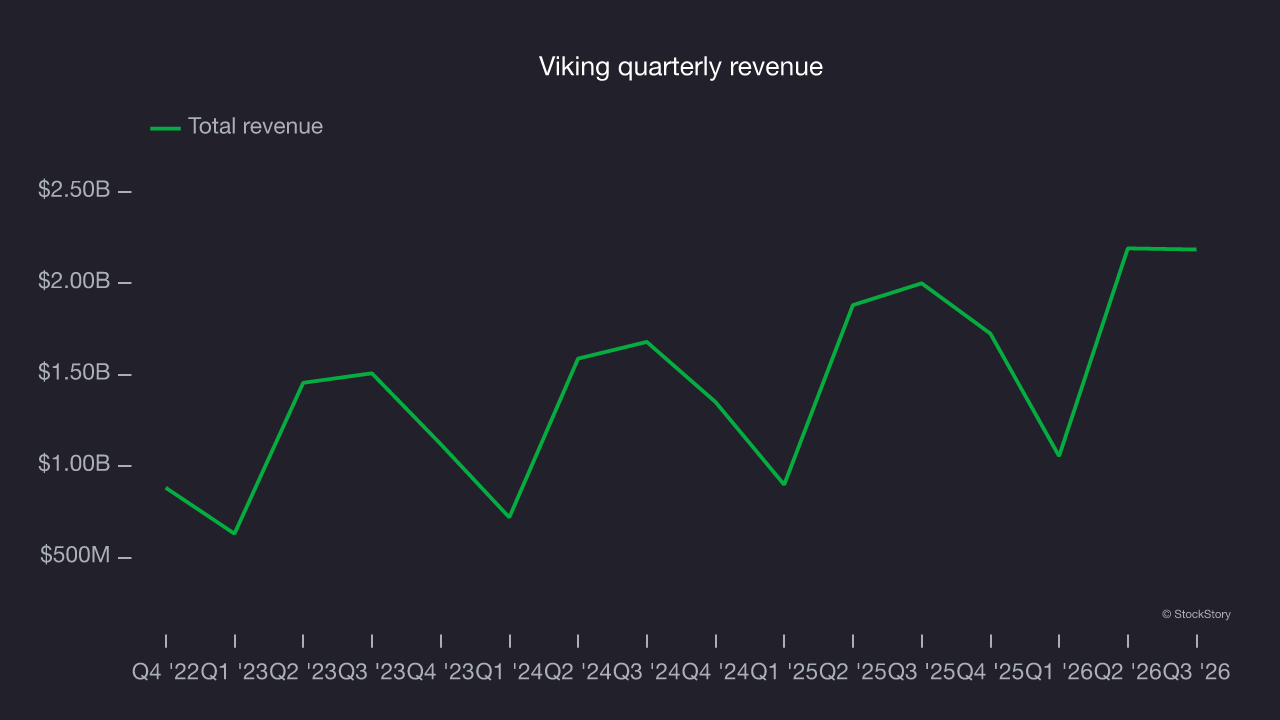
Long-term growth matters most, but within consumer discretionary, a longer historical view may miss a company benefiting from a successful new property or trend. Viking’s recent performance shows its demand has slowed as its annualized revenue growth of 18.4% over the last two years was below its three-year trend. Decelerating revenue growth in the sector warrants caution, as it could signal changing consumer tastes aided by low switching costs. 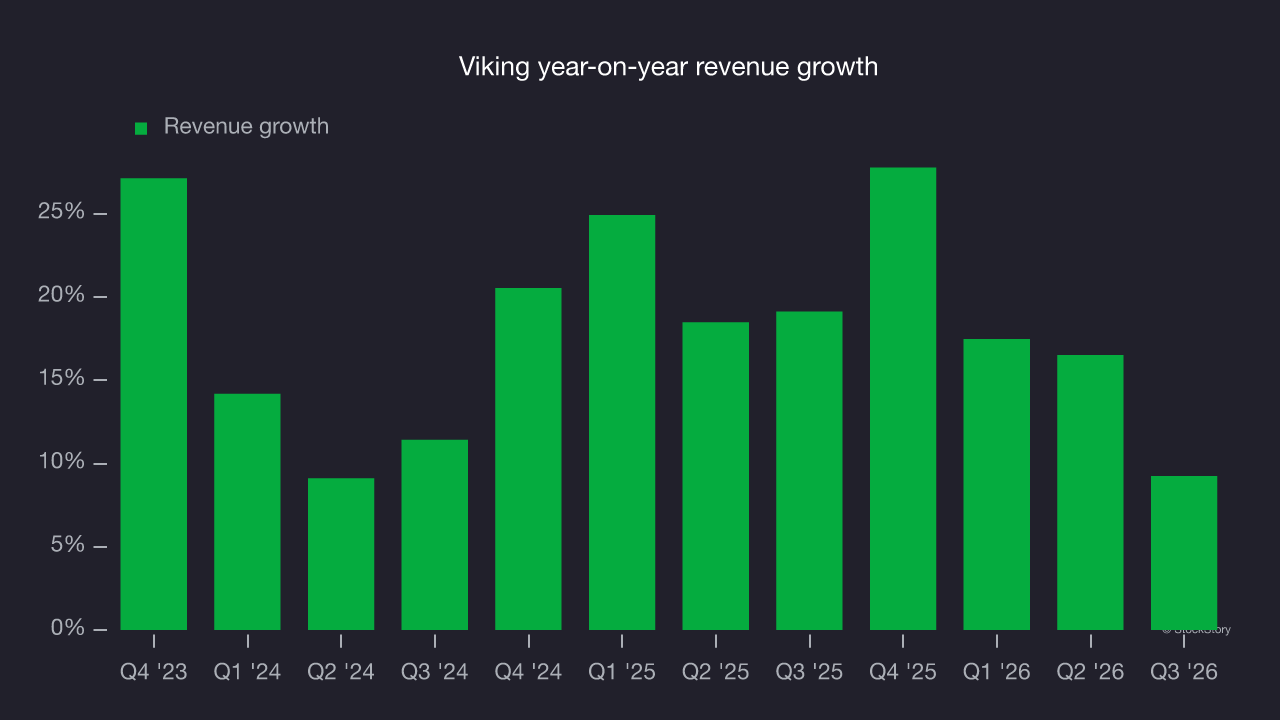
This quarter, Viking’s revenue grew by 9.2% year on year to $2.18 billion, missing Wall Street’s consensus estimates.
Looking ahead, sell-side analysts expect revenue to grow 18.7% over the next 12 months, according to S&P, similar to its two-year rate. This projection is healthy and implies the market is forecasting success for its products and services.
Operating margin
Operating margin is a key measure of profitability. Think of it as net income – the bottom line – excluding the impact of taxes and interest on debt, which are less connected to business fundamentals.
Viking’s operating margin has generally stayed the same over the last 12 months, although increases driven by economies of scale and cost efficiency are generally preferable over time.
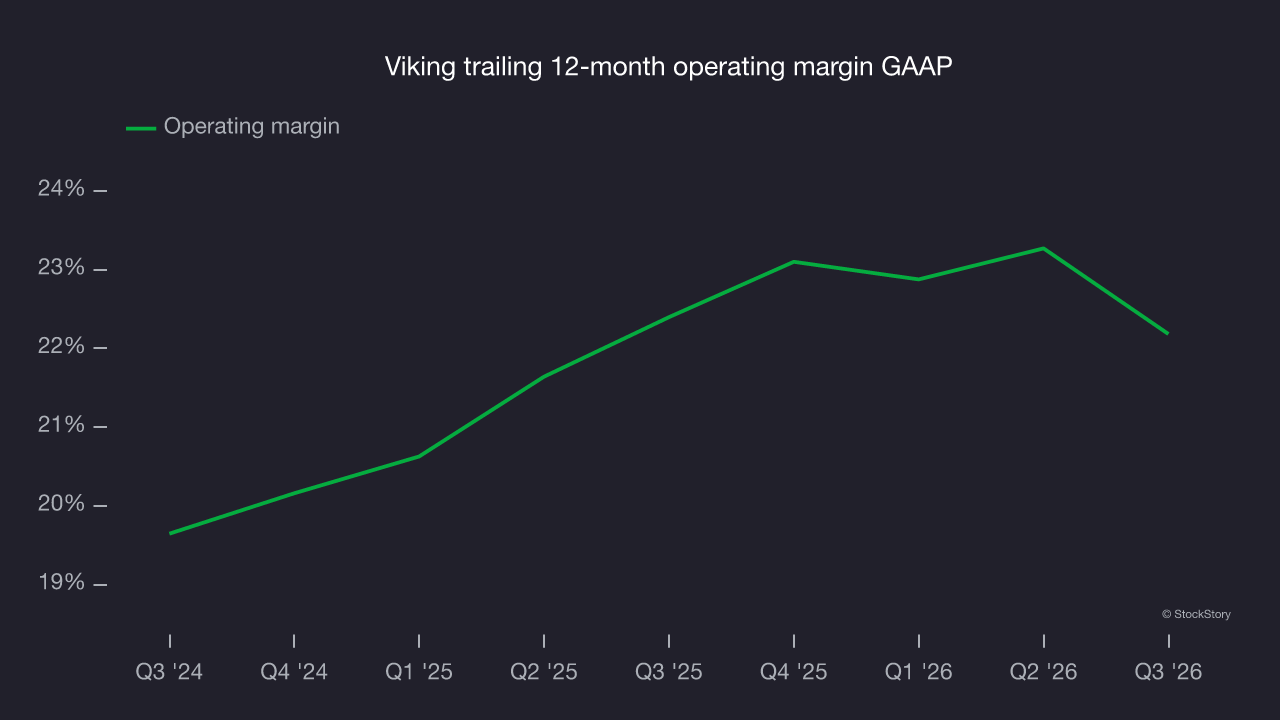
In Q3, Viking generated an operating profit margin of 26.1%, down 4.1 percentage points year on year. This contraction shows it was less efficient because its expenses grew faster than its revenue.
Cash flow
Although earnings are valuable for assessing company performance, cash is essential because accounting profits alone can’t pay the bills.
Viking has shown poor cash profitability relative to peers over the last two years, giving the company fewer opportunities to return capital to shareholders. Its free cash flow margin averaged 13.2%, below expectations for a consumer discretionary business.
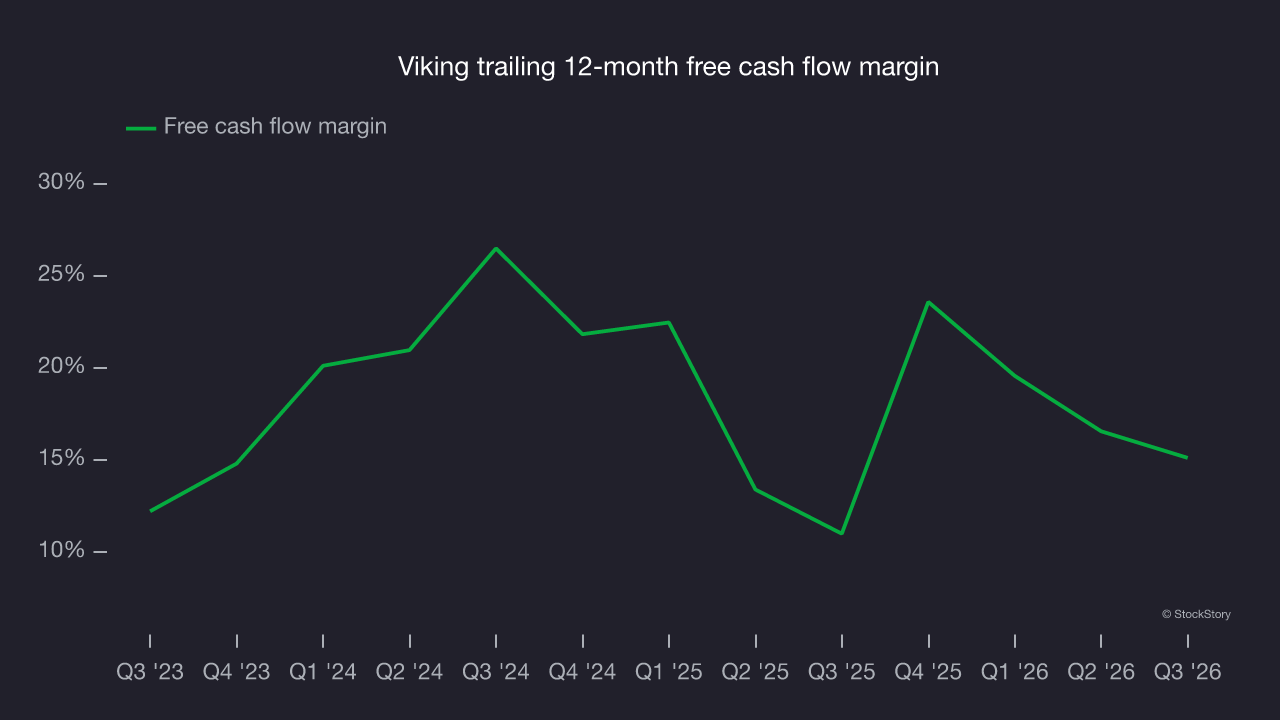
Viking’s free cash flow totaled $536.6 million in Q3, equivalent to a 24.6% margin. The company’s cash profitability declined by 5.9 percentage points from the same quarter last year, but remained above its two-year average. This quarter’s decline should be viewed with caution because capital expenditures can be seasonal and companies often build inventory in anticipation of higher demand, leading to short-term swings. Long-term trends matter more than temporary fluctuations.
Over the next year, analysts predict Viking’s cash conversion will improve. Their consensus estimates, according to S&P, imply its free cash flow margin of 15.1% for the last 12 months will increase to 21.2%, giving it more flexibility for investments, share buybacks and dividends.
Key takeaways from Viking’s Q3 results
Viking’s Q3 results offered few positives, with both EPS and EBITDA falling short of Wall Street’s consensus estimates. It was a disappointing quarter, and shares remained flat at $89.78 immediately after the release.
Viking may have had a tough quarter. To assess the investment case, consider its valuation and business quality as well as the latest quarterly results. For more on Viking, read the full research report here (it’s free).