
Amada (TSE:6113) Faces A Guidance Review As Investors Ask If The Stock Is Already Pricey
Amada (TSE:6113) has called a board meeting for 12 November 2026 to review possible revisions to its full year financial forecasts. This move often reshapes expectations around future business performance.
Recent price action around Amada reflects that tension. The share price jumped 7.6% on the day and delivered a 16.8% share price return over the past week, yet it is still down 10.8% over 90 days. Long term total shareholder return sits at 38.2% over one year and 157.0% over five years, which hints at strong long run compounding even as short term momentum has been fading into this guidance review.
Scan how Amada compares with other machinery and automation plays by running a focused search through 86 robotics and automation stocks while this guidance review is in the spotlight.
After a sharp rebound yet a softer 90 day patch, Amada now asks a simple question of you. Does the current valuation still skew the risk and reward in favour of fresh buyers, or not?
Preferred P/E of 22.5x for Amada: Is it justified?
On Simply Wall St's numbers, Amada trades on a P/E of 22.5x, while the last close was ¥2,468. That valuation sits well above several benchmarks that investors often use to frame expectations.
The P/E ratio compares the current share price to earnings per share. For a machinery group like Amada, it acts as a shorthand for how much investors are willing to pay for each unit of profit, given its earnings profile and forecast growth.
Analyst expectations point to earnings growth of 12.7% per year for 6113, which is ahead of the 9.8% per year projected for the wider JP market. At the same time, the stock is described as expensive on a P/E basis compared with the peer average of 17.9x and an estimated fair P/E of 18.6x. That gap suggests the market is paying a premium that could compress if sentiment cools and the multiple drifts closer to the level the fair ratio implies.
The comparison with the JP Machinery industry is even starker. Amada's P/E of 22.5x sits materially higher than the sector average of 12x, indicating investors value its earnings at almost double the rate of the typical machinery peer. For readers, that signals expectations for stronger profitability or resilience are already embedded into the current valuation.
Explore the SWS fair ratio for Amada.
Result: Price-to-earnings of 22.5x (OVERVALUED)
Still, Amada’s premium P/E could unwind quickly if the November 12 guidance review softens earnings forecasts or if capital spending for metal processing equipment cools.
Find out about the key risks to this Amada narrative.
Another view on Amada’s value
The first lens paints Amada as expensive based on its 22.5x P/E, yet the SWS DCF model points in a different direction. On that framework, the shares at ¥2,468 are trading about 9.1% below an estimated future cash flow value of ¥2,715.04, which hints at a cushion rather than a premium. The question is which signal you trust more when a forecast review is only weeks away.
For a closer look at how that cash flow view is built and where the key sensitivities sit, Look into how the SWS DCF model arrives at its fair value.
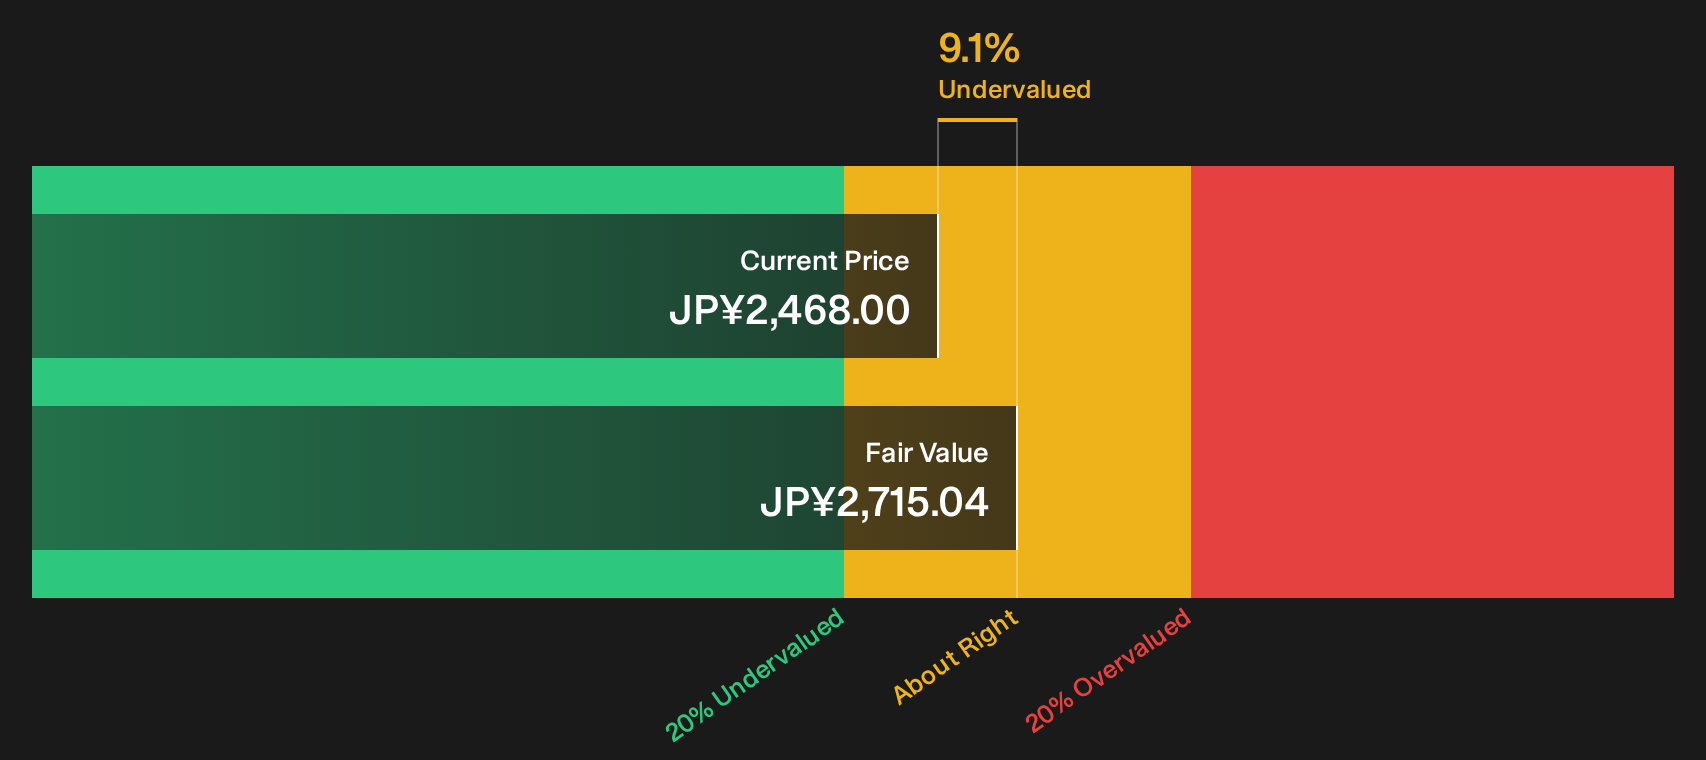
Simply Wall St performs a discounted cash flow (DCF) on every stock in the world every day (check out Amada for example). We show the entire calculation in full. You can track the result in your watchlist or portfolio and be alerted when this changes, or use our stock screener to discover 19 high quality undervalued stocks. If you save a screener we even alert you when new companies match - so you never miss a potential opportunity.
Next Steps
Sentiment around Amada is clearly split, which is exactly why investors are watching it so closely right now and moving fast to interpret the signals. To weigh the upside against the concerns directly, start with the 4 key rewards and 2 important warning signs.
Looking for more investment ideas beyond Amada?
If Amada has your attention, do not stop there. Cast the net wider now so you are not chasing opportunities after others have already moved.
- Target potential mispricing by scanning for quality companies that screens highlight as priced below their fundamentals through the 19 high quality undervalued stocks.
- Build an income focused watchlist by filtering for resilient payers that feature in the 28 dividend fortresses.
- Reduce portfolio stress by concentrating on financially robust businesses surfaced in the list of solid balance sheet and fundamentals (24 results).
Have feedback on this article? Concerned about the content? Get in touch with us directly. Alternatively, email editorial-team@simplywallst.com