
When the Gamma Map Flips at the Open: SPX 0DTE Case Study
On Friday, November 13, the premarket TradeGuidance gamma map put SPX in positive gamma, the regime where dealer hedging tends to calm the tape. Then the cash open came in lower, SPX slipped under its gamma flip, and the indices sold off hard. A same-day SPX put butterfly built around that flip still closed up $740.70 net on one lot. This is the story of why the map changed, and why the trade worked anyway.
What the 8:40 map said
Before the open, /ES was at 7,660, which implied SPX near 7,637. At that level the map read positive gamma, with the walls and the flip stacked close together.
| SPX level (8:40 a.m. ET) | Value | What it means |
|---|---|---|
| Regime | Positive, +$14.4B per 1% | Hedging tends to dampen moves |
| Call wall / largest gamma strike | 7,650 | Overhead resistance and magnet |
| Gamma flip | 7,602 | Below it, hedging starts to amplify moves |
| Put wall | 7,600 | Support to watch |
| ATM straddle | 37.7 points | The market’s expected move for the day |
| Trend-day odds | 40% | A heuristic, not a forecast |
The key line is the flip at 7,602. Positive gamma only holds while SPX stays above it, and the premarket read is built from futures before the cash market trades.
What changed at the open
SPX opened below the flip. By the 9:39 live run, SPX was at 7,587.52, the map had turned to negative gamma (about −$2.5B per 1%), the put wall had dropped to 7,550, the straddle had widened to 43.4 points and trend-day odds were up to 65%. The map itself flagged the read as fragile because price was sitting right at the flip. In negative gamma, hedging adds to moves instead of absorbing them, and the selloff that followed fit that regime, not the premarket one.
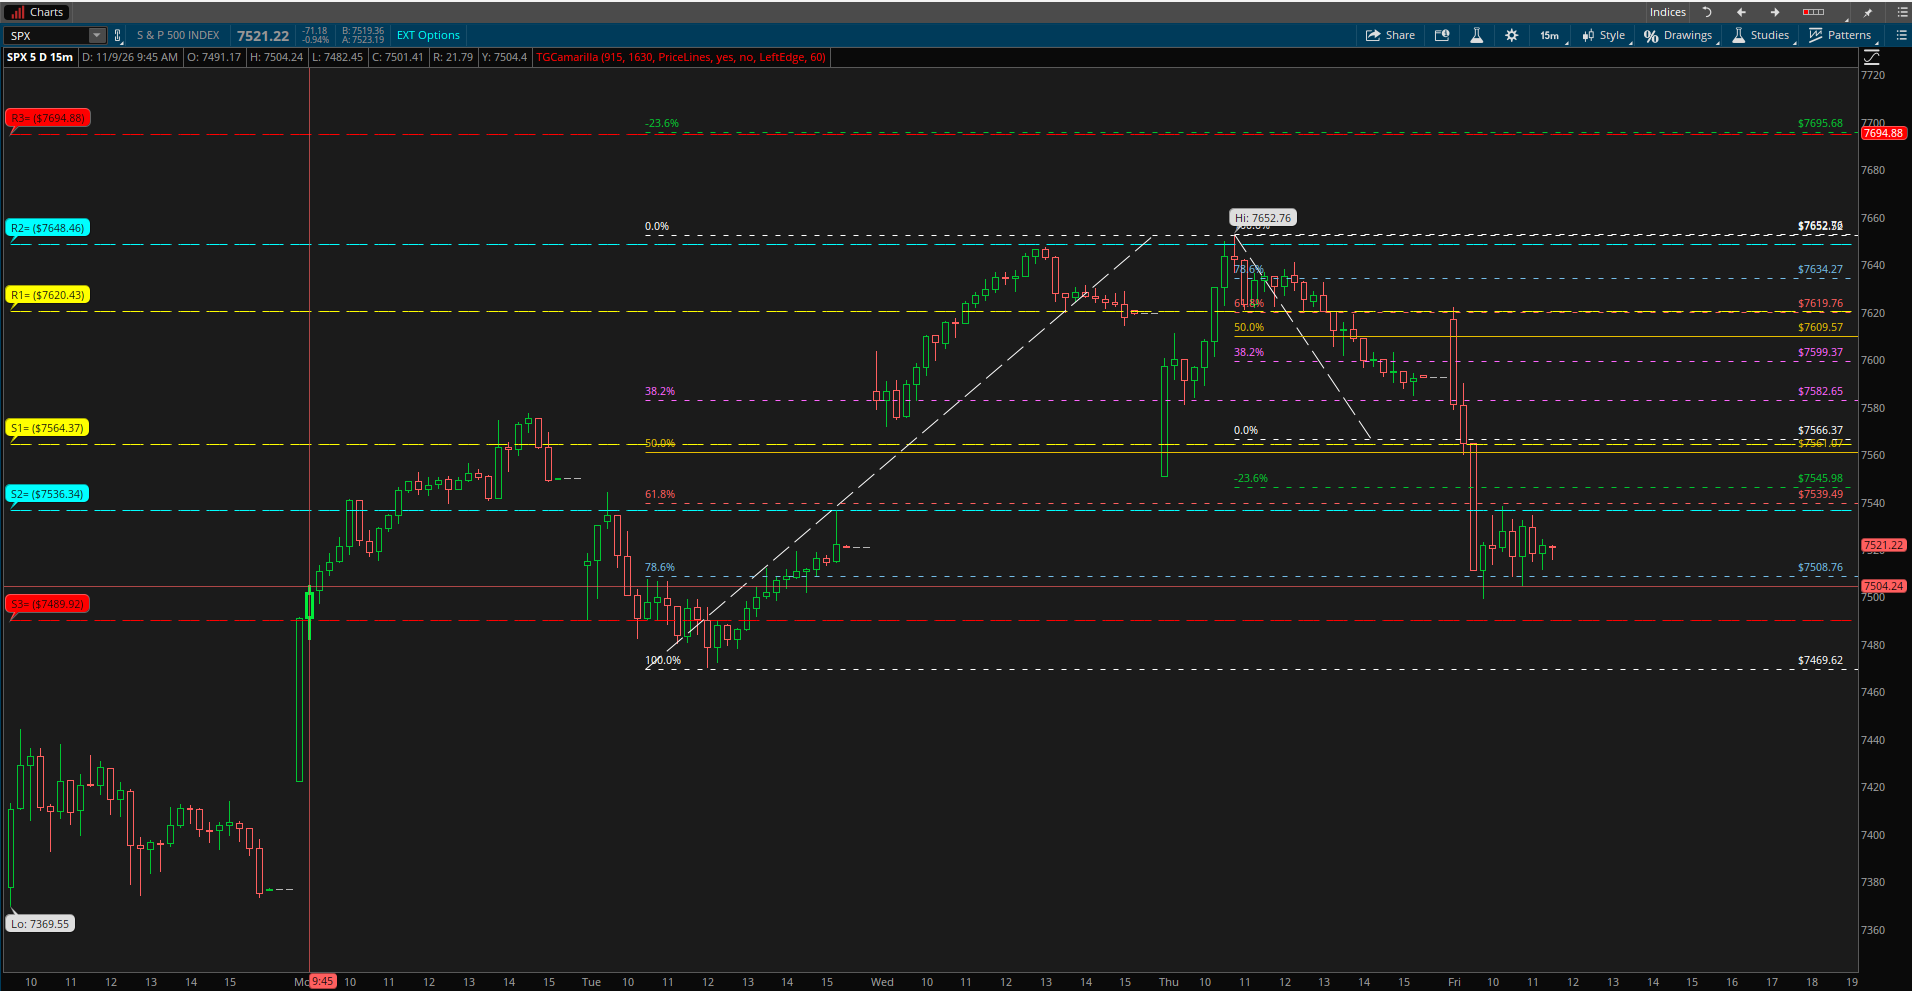
SPX 15-minute chart, Nov 9–13, with TradeGuidance Camarilla pivots and Fibonacci levels (thinkorswim)
On the chart, Friday’s drop ran from the 7,620 area straight down through the Camarilla S1 at 7,564 and S2 at 7,536. SPX found its low at 7,504.24, just above the 78.6% retracement of the week’s rally at 7,508.76.
The trade
The fly was centered on the flip area, with 65-point wings: sell one 7,650 put, buy two 7,585 puts, sell one 7,520 put, for a net credit. Selling the wings and buying the body makes this a short butterfly. It earns most when SPX finishes well away from the 7,585 body, in either direction, and loses most if SPX settles right on the body. That made it a trade on movement, which is what a negative-gamma open tends to deliver.
The choice of a short fly over a long one was deliberate. There was no strong conviction that SPX would push higher, or that it would drop to a level and stall there. A long fly (buy the wings, sell two at the body) needs price to come in and settle near 7,585. The short fly instead pays if price travels toward either wing, so the trade did not depend on calling the direction, only on SPX moving away from the middle.
| Per fly | Dollars | |
|---|---|---|
| Opened for a net credit of | 31.50 | $3,150 |
| Breakevens at expiration | 7,551.50 and 7,618.50 | |
| Most it could lose | 33.50 (65-point wing minus the credit) | $3,350 |
| Closed for a net debit of | 24.00 | $2,400 |
| Result | +7.50 points | +$750 gross, +$740.70 after $9.30 in commissions and fees |
After entering, a closing limit order was placed and left working, and the position was not watched tick by tick. The order filled with SPX around 7,540, near the S2 pivot and below the 7,551.50 lower breakeven. That is about a 22% return on the $3,350 at risk.
Three lessons
- A premarket regime is conditional. “Positive gamma” at 8:40 meant positive gamma above 7,602. When SPX opened under the flip, the map changed with it. Rerun or recheck the map after the open before trusting the premarket regime.
- Match the structure to your conviction. A long butterfly is a bet on where price lands. When you expect movement but don’t know the direction, a short butterfly lets a move toward either wing do the work, which is what happened once the regime turned negative.
- Let a resting order do the watching. A closing limit at a planned price took profit while no one was at the screen. Plan the exit when you plan the entry.
Disclosure
This was a trade in a TradeGuidance managed trading account, traded by the Lead Analyst. Results are shown before and after commissions and fees. Gamma levels are model output from public-style assumptions, not a measurement of actual dealer positioning. SPX options are European-style and cash-settled; a put butterfly and a call butterfly on the same strikes have the same expiration payoff. SPX levels at entry and exit are approximate, inferred from the option fills.
All investments involve risk. This material is for educational purposes only and is not investment advice. Options can lose their full value quickly; past results do not predict future results. © Trade Guidance 2026.