
NOF (TSE:4403) Reports Strong Half Year Earnings And Buyback, Does It Look Fairly Valued?
NOF (TSE:4403) has come into focus after reporting half-year sales of ¥139,608 million and net income of ¥16,985 million on November 5, alongside a new ¥5,000 million share repurchase program.
Recent trading shows mixed sentiment around NOF. The share price edged up over 1 day with a 1.50% move to ¥2,579.0 after the earnings and buyback news, yet it remains down 14.03% on a year-to-date share price return. However, the 5-year total shareholder return of 47.12% points to stronger longer term compounding despite this year’s weaker momentum.
Compare how NOF’s buyback and earnings story stacks up against other potential opportunities by scanning our hand picked 74 high quality undiscovered gems with strong fundamentals and under-the-radar appeal.
For NOF, a rising share price on the day and a weaker year-to-date chart pull in different directions. Is the current valuation telling you more about sentiment than about the underlying chemicals business?
Preferred P/E of 13.7x for NOF: Is it justified?
On valuation, NOF trades on a P/E of 13.7x, which is higher than the 12.1x average for the JP Chemicals industry but lower than the 20.6x peer group average. The market is therefore pricing it somewhere between sector and broader peer expectations.
The P/E ratio compares the current share price to earnings per share. For a diversified chemicals group like NOF, it serves as a rough gauge of how much investors are willing to pay for each unit of current profit from segments such as functional chemicals, pharmaceuticals related materials, and industrial agents.
Relative to industry peers, a 13.7x P/E sits at a premium to the chemicals sector average. This points to investors assigning a higher price to NOF's earnings than to those of the typical listed rival. Against the estimated fair P/E of 13.6x, that premium looks slender, so the market price is already very close to the level the fair ratio model suggests it could move toward if expectations converge.
Explore the SWS fair ratio for NOF.
Result: Price-to-earnings of 13.7x (ABOUT RIGHT)
Still, if NOF faces weaker demand across key regions such as Japan or pressure in higher margin segments like Functional Chemicals, the current earnings multiple could look stretched.
Find out about the key risks to this NOF narrative.
Another View: What NOF’s Cash Flows Suggest
While the 13.7x P/E hints that NOF is roughly in line with its fair ratio, the SWS DCF model paints a different picture. On that cash flow view, the share price of ¥2,579 sits about 28.2% below an estimate of future value around ¥3,592.2. Could the gap reflect excessive caution rather than fundamental weakness?
Look into how the SWS DCF model arrives at its fair value.
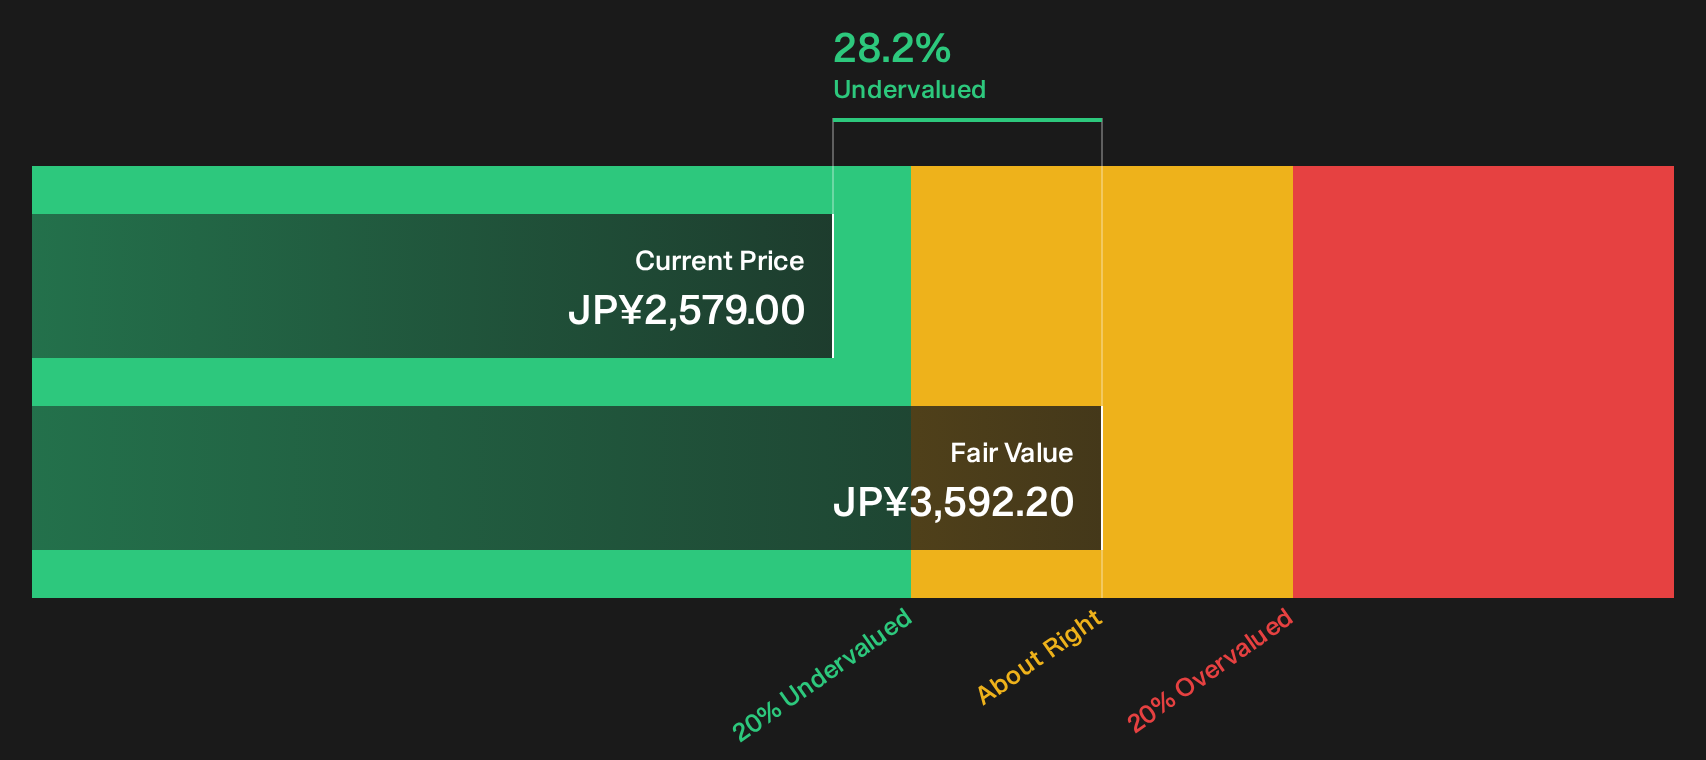
Simply Wall St performs a discounted cash flow (DCF) on every stock in the world every day (check out NOF for example). We show the entire calculation in full. You can track the result in your watchlist or portfolio and be alerted when this changes, or use our stock screener to discover 18 high quality undervalued stocks. If you save a screener we even alert you when new companies match - so you never miss a potential opportunity.
Next Steps
Seen enough to sense where sentiment leans on NOF, yet still unsure which side you agree with? Act while the data is fresh and pressure test the upside by reviewing its 5 key rewards.
Looking for more investment ideas beyond NOF?
If NOF has sharpened your focus on valuation and quality, do not stop here. Broader idea hunting now could shape your next few decisions.
- Target potential mispricing by reviewing companies that screen as quality opportunities using the 18 high quality undervalued stocks.
- Strengthen your income stream by hunting for robust payers through the 27 dividend fortresses.
- Dial down portfolio risk by focusing on resilient businesses in the 20 resilient stocks with low risk scores.
Have feedback on this article? Concerned about the content? Get in touch with us directly. Alternatively, email editorial-team@simplywallst.com