
Have U.S. Interest Rates Peaked?
I highlighted why the U.S. long bond futures broke out of the multiyear consolidation range in a September 22, 2026, Barchart article, where I concluded with the following:
Debt, inflation, and uncertainty in the economic and geopolitical landscape have pushed interest rates to the highest level in years. In September 2026, the bearish trends in bonds and TLT continue, but if rising rates cause a risk-off period in markets, we could see bonds rally, as a flight to quality often supports gains in the bond market. Meanwhile, rising rates support the U.S. dollar, which is historically bearish for commodity prices. In 2026, historical trends may not hold.
Long bond futures fell to a 24-year low but have bounced before, challenging the next critical support level.
The bonds tank and recover
U.S. 30-year Treasury Bond futures fell from the March 2020 pandemic-inspired high of 191-22 to the October 2023 low of 107-04, which became a critical technical support level.
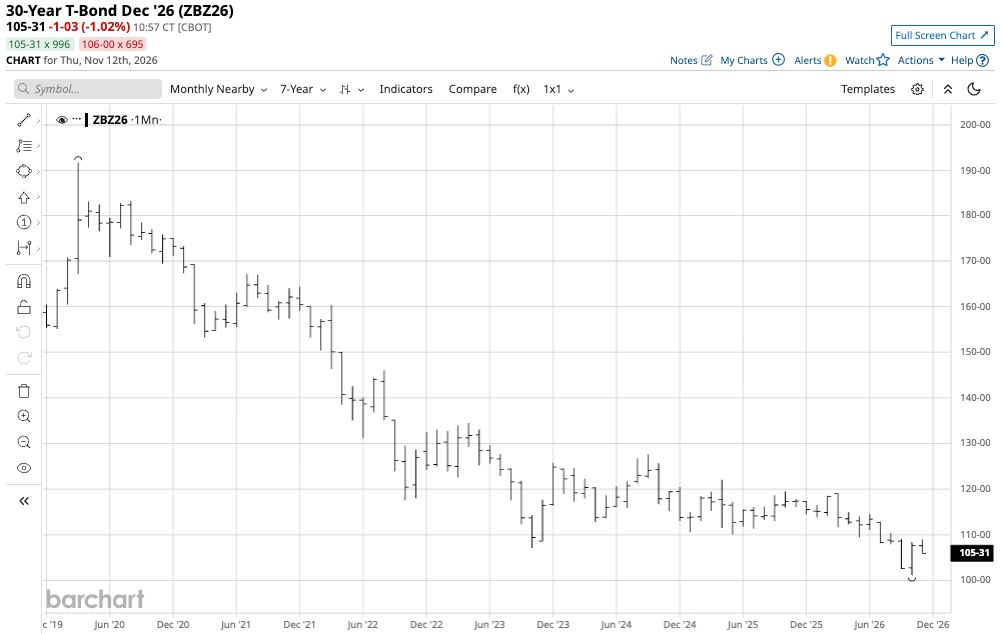
The monthly continuous contract chart shows that the long bond futures remained above the October 2023 low until August 2026. In September 2026, the futures fell through support and made lower lows, reaching 101-05 in October 2026.
The next support level is at the March 2002 low
The quarterly continuous contract chart shows that the long bond futures declined to the lowest level in over 24 years.
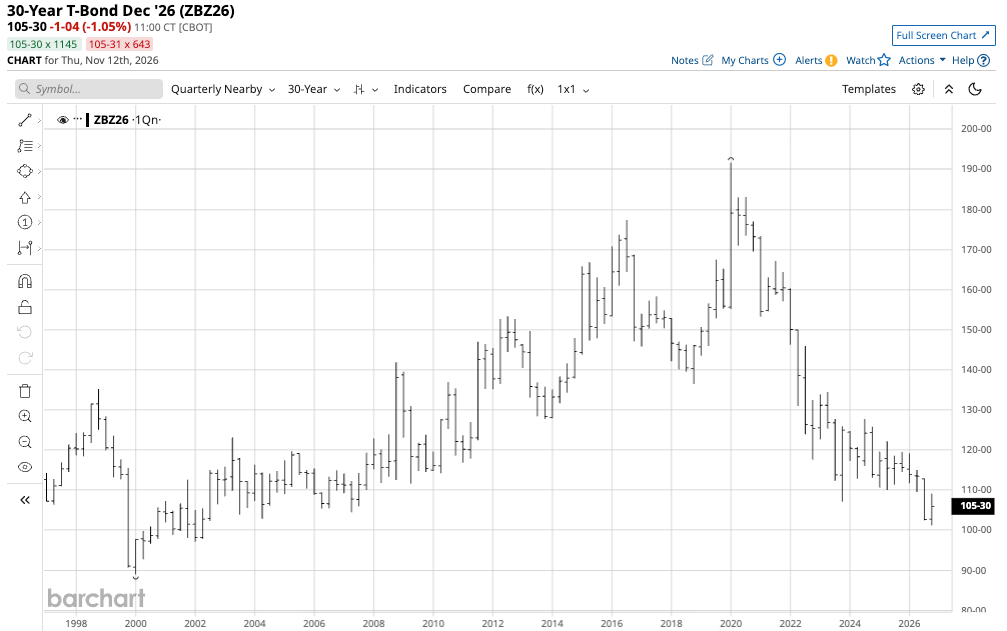
The chart shows futures reached the lowest level since Q2 2002, and while they recovered to over 107, technical support is now at the Q1 2002 low of 97-06. Below that, the next support level is at the Q1 2000 low of 89-01.
The bullish case for the long bond
The fundamental bullish case for the long bond futures includes the following:
- Rising interest rates make long-term yields more attractive, attracting capital to long-term U.S. government debt securities.
- The United States remains the world’s leading economy, and the dollar is the global reserve currency.
- Geopolitical turmoil historically attracts capital to the U.S. bond market.
- The leading U.S. stock market indices are at or near all-time highs. Portfolio diversification supports higher fixed-income capital allocations as yields rise.
- U.S. economic growth supports stable or lower yields for U.S. government debt securities.
The bearish case for the long bond
The fundamental bearish case for the long bond futures includes the following:
- U.S. debt has grown to over $40.45 trillion. The debt has weighed on the U.S. government’s full faith and credit, putting downward pressure on bond prices.
- Stubborn inflation since the 2020 global pandemic has driven prices higher and kept inflation indicators above the Federal Reserve’s 2% target. The FOMC recently raised the short-term Fed Funds Rate for the first time since 2023 and said additional rate hikes are likely on the horizon.
- While the Fed controls short-term rates through the Fed Funds Rate. monetary policy cannot control longer-term interest rates, which the bond market sets. Inflation pushes long-term rates higher.
- The trend in the long bond futures since 2020 has been lower, and the break below the October 2023 low only further validated that bearish trend. Trends are traders’ or investors’ best friends.
TLT and TBF for long and short exposure
Bullish and bearish factors are pulling long-term interest rates in opposite directions, but in late 2026, the bears are in control. While the long bond futures have bounced from the October 2026 low of 101-05, the path of least resistance remains lower.
Going with the flow supports the bearish case for bonds. The Short 20+ Year U.S. Treasury -1X ETF (TBF) moves higher as the long-term U.S. Treasury Bond futures move lower. At $26.01 per share, TBF had over $114 million in assets under management. TBF trades an average of over 250,000 shares per day and charges a 0.95% management fee. The annual $0.59 dividend yields 2.27%.
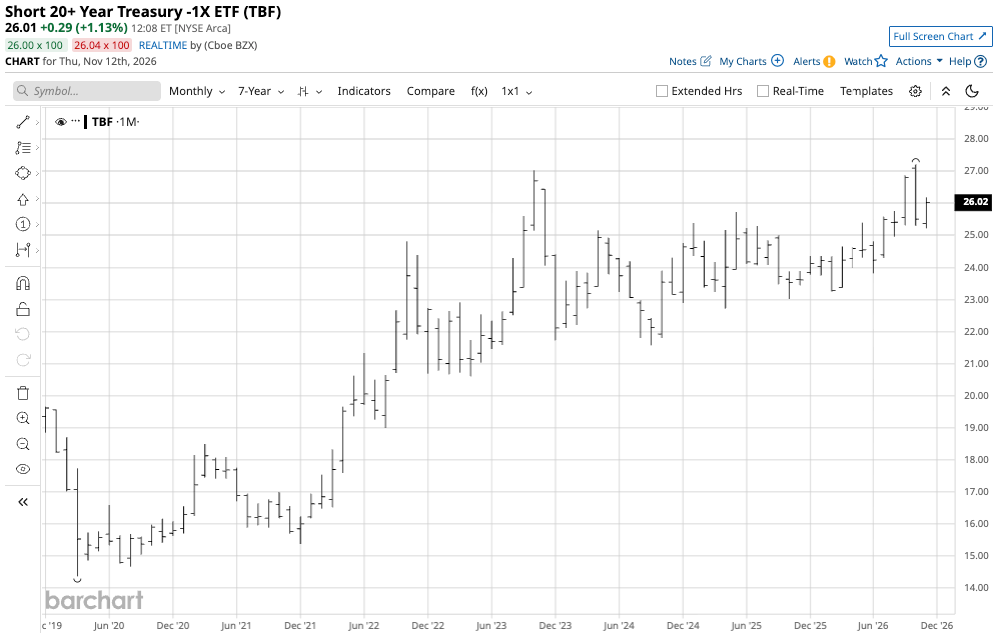
The monthly chart shows that TBF moved 89.5% higher from the March 2020 low of $14.36 to the October 2026 high of $27.21 per share.
The iShares 20+ Year Treasury Bond ETF (TLT) moves higher as the long-term U.S. Treasury Bond futures appreciate. At $79.93 per share, TLT had over $47.61 billion in assets under management. TLT trades an average of over 34.6 million shares per day and charges a 0.15% management fee. The annual $4.24 dividend yields 5.30%.
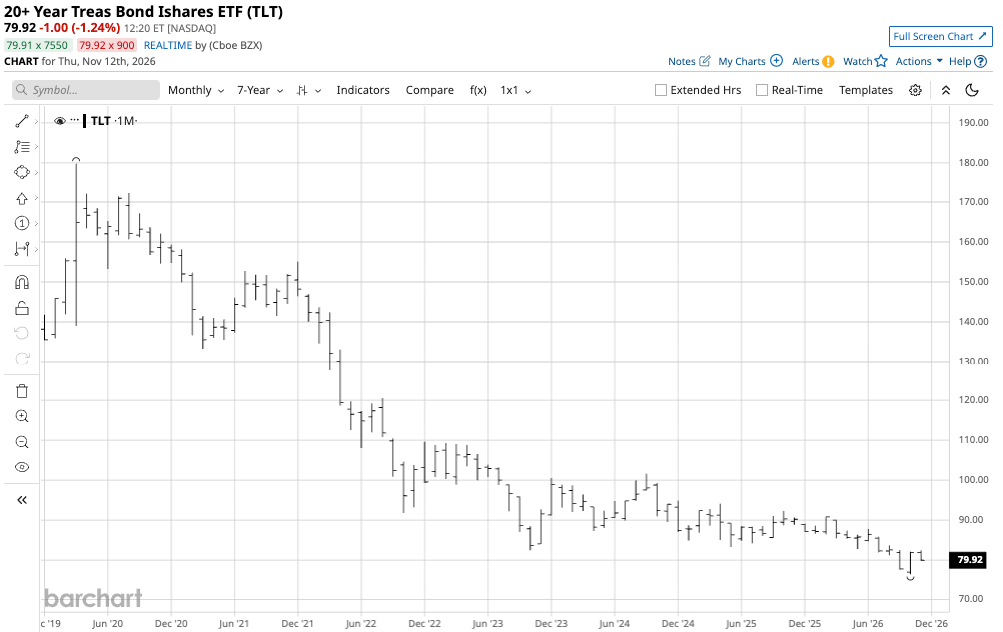
The monthly chart shows that TLT fell 57.5% from the March 2020 high of $179.70 to the October 2026 low of $76.43 per share.
In November 2026, the trend in the long-bond futures remains lower, favoring the TBT ETF. The trend is a trader’s or investor’s best friend until it bends. Time will tell if the bounce from the October 2026 low in the long-bond futures reflects a bending trend. U.S. interest rates are at their highest level in nearly a quarter century. Long-term rates reflect sentiment, which remains bearish but may have peaked. A decline below the next technical support level at 97-06 could devastate markets across all asset classes. Higher rates could filter through markets, causing a risk-off period that may, ironically, cause a bond market rally. Therefore, keep a close eye on the bond market as it may provide clues about the path of least resistance for stocks, commodities, real estate, and cryptocurrencies. Optimists expect a continued bond recovery, while pessimists expect higher yields and a continuation of the bearish bond trend.
On the date of publication, Andrew Hecht did not directly have a position in any of the securities mentioned in this article. All information and data in this article is solely for informational purposes. For more information please view the Barchart Disclosure Policy here.