
Beaten-Down Hudbay Minerals (HBM) Stock Offers a Compelling Contrarian Narrative
Among the worst-performing large-capitalization “losers” over the past three months, Hudbay Minerals (HBM) stands out as an intriguing, come-from-behind contrarian candidate. Sure, HBM stock is an ugly name right now, as assessed by Barchart’s Technical Opinion ranking of 56% Sell. However, the fundamental argument rests with the relevance of its upstream critical minerals business.
It’s no secret that advanced technologies require key commodities to run and propagate. That’s especially true for artificial intelligence. While large language models may dominate the headlines, the processors and data center infrastructures necessary to keep the engine running represent the true heavyweights. Upstream specialists like Hudbay are therefore integral to the broader AI story, which should bode well for HBM stock in the long run.
This framework also segues into the near-term picture, which is particularly useful for options traders. At this moment, Hudbay Minerals stock is reeling from technical weakness. In the trailing month, HBM has dropped nearly 16% in value, implying dominance of the bears. Still, an excessive sentiment imbalance could catalyze a countervailing response, which is one of the arguments supporting mean reversion.
From basic inference, we may reasonable assume that HBM stock has absorbed a significant amount of bearish news. But in order to justify continued downside, the market arguably requires more units of pessimistic news. The thing is, additional pessimism may be exponentially harder to find when so much ugliness has already been baked into the share price.
Of course, it’s not a guaranteed inference — the market follows its own rules of rationality (which may be different from yours). What can separate a mere assumption from potential insight is historical data. If we can study how Hudbay Minerals stock reacted to similar circumstances, we may have a better idea of what we might expect in the future.
What’s Unique About HBM Stock Right Now?
So, the first question we must ask ourselves is this: is there anything special or unique about Hudbay Minerals stock that we can use as a historical reference for forecasting purposes? The answer is “yes” — if we break market sentiment into discrete quantitative categories.
Anybody that looks at a technical chart can see that HBM stock is currently mired in a bearish state. Specifically, in the past 10 weeks, only two of the weekly candlesticks represented positive growth (from Monday’s open to Friday’s close). That means we have an eight-to-two ratio of bearish candlesticks versus bullish candlesticks.
How common is this ratio? Not very — in the trailing five years, this particular quantitative setup has only appeared nine times on a rolling basis. Unfortunately, we can’t make a statistically significant inference off such an extremely small sample size but there is a trend that is noticeable.
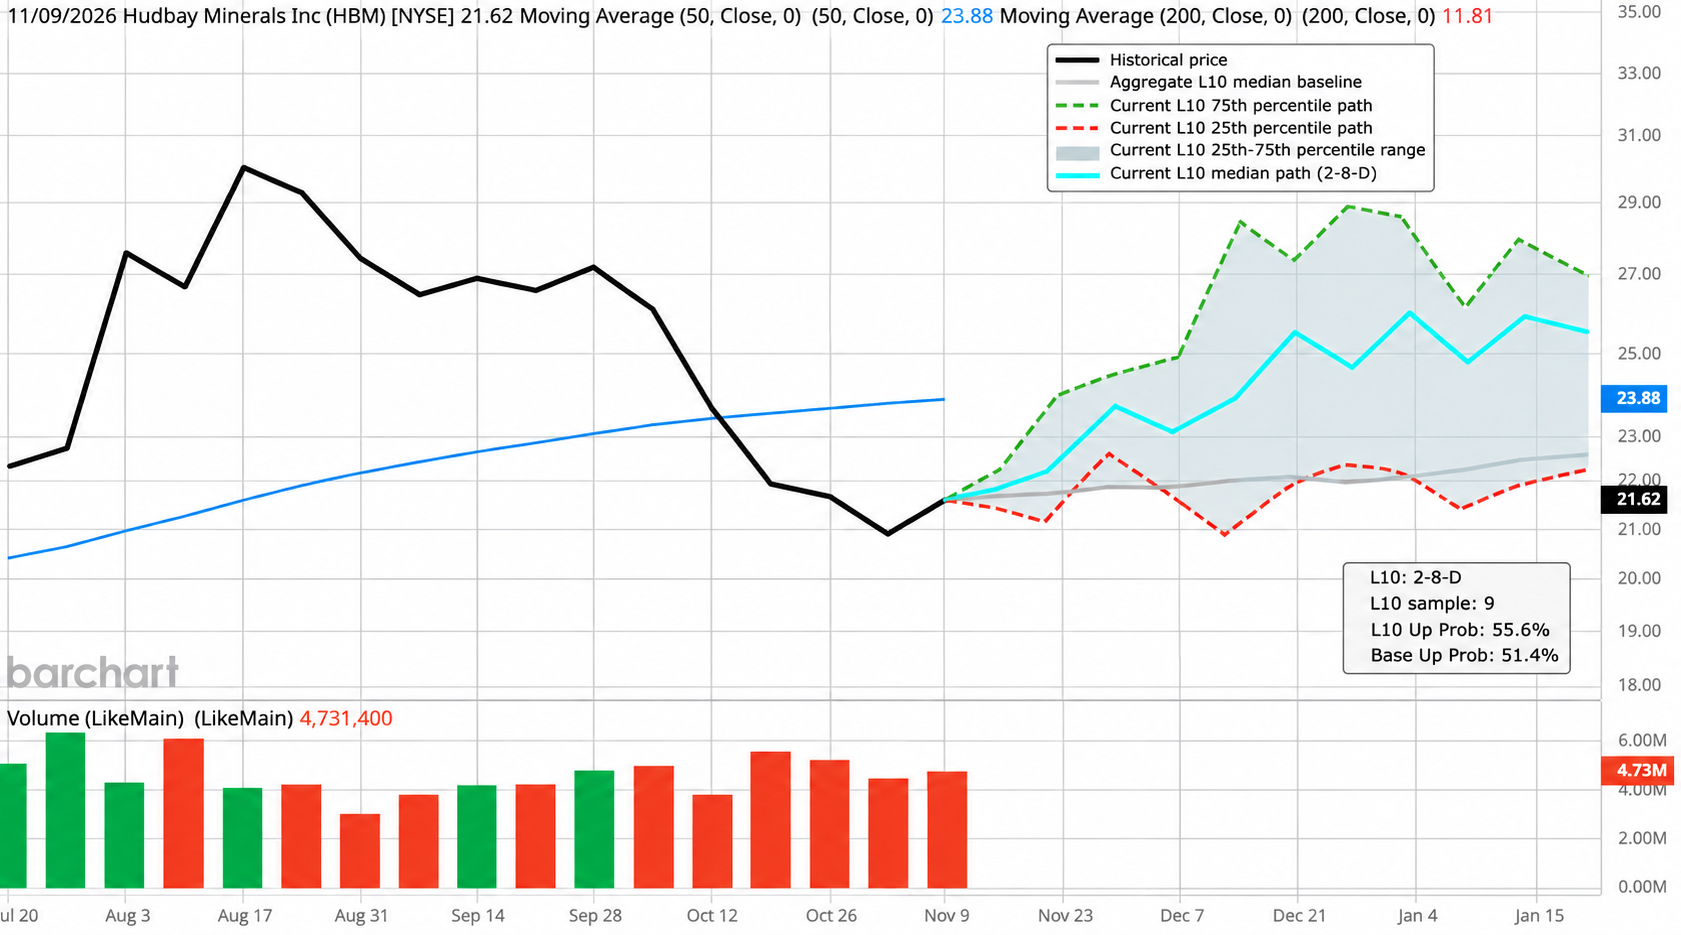
Following the flashing of this ratio, HBM stock typically enjoys a contrarian transition from a bearish state to a bullish one. If the observed pattern were to materialize again over these next few weeks, we would expect the median terminal price on Dec. 18 to land above $25.
Arithmetically speaking, the probability of this outcome would be 55.6% (though I would take this assessment with a heavy grain of salt due to the small sample size). Still, the historical pattern of HBM stock following the printing of the aforementioned eight-to-two ratio makes the 22.50/25 bull call spread expiring Dec. 18 rather interesting.
Given the structure of how bull spreads work, the trade would really only make sense if there’s a legitimate chance of HBM stock hitting $25 on expiration. Since the historical data suggests that the contrarian speculator may have the advantage, it may be a tempting proposition.
Is the Next Price Up Too Aggressive?
Now, you’ll notice that the $25 bull spread is favorably asymmetric, with a maximum payout (at time of writing) of 127.27%. Given the net debit (cash outlay) required of $110 and assuming a win rate of 55.6%, the expected value (EV) of the trade would be $29 or a return on capital (ROC) of 26.36%.
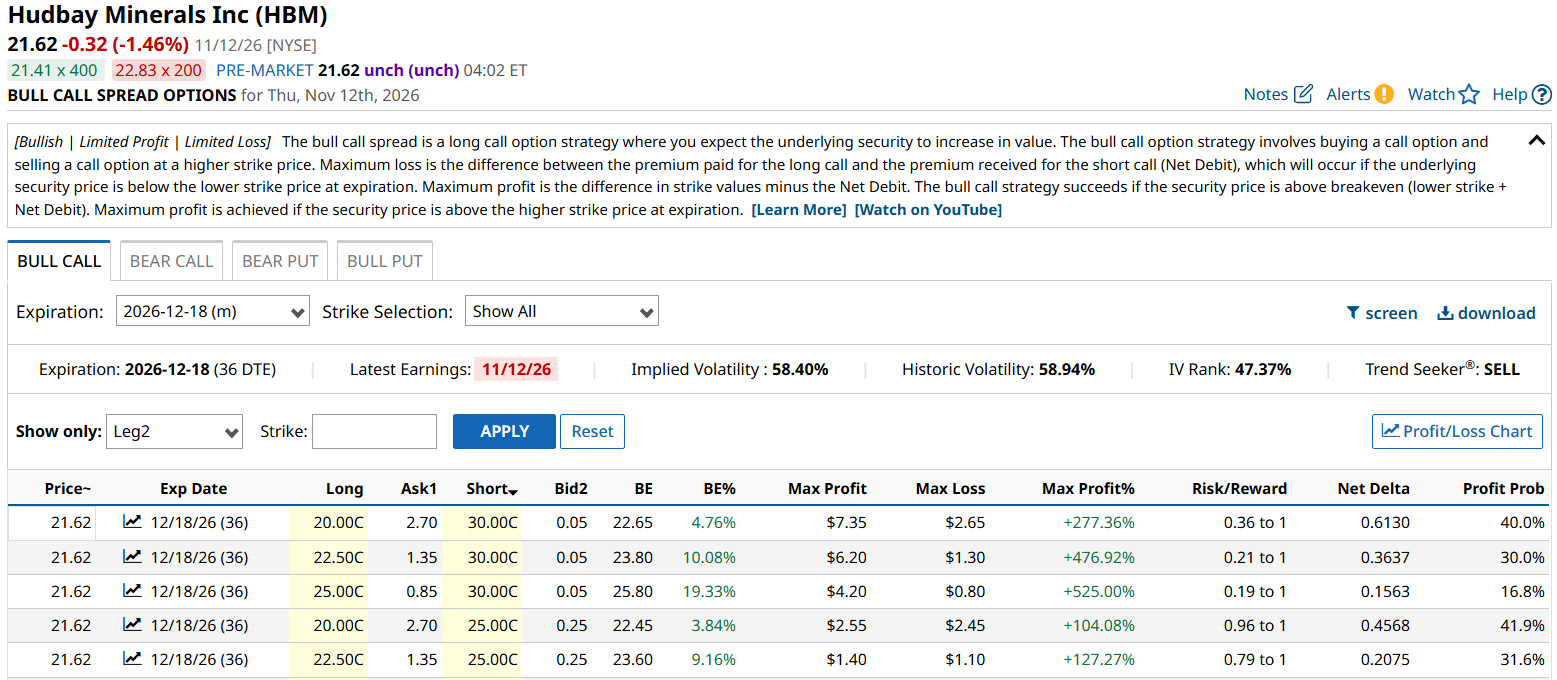
Of course, the next leg up in the December options chain is the second-leg strike of $30. At the most aggressive spread, the 25/30 variant currently offers a maximum payout of $525 (off an initial wager of $80). That would skyrocket the underlying EV if the win rate was high enough.
Unfortunately, based on the data, I don’t think $30 is a realistic target over the next five weeks. If we were to apply the same transitional logic off the eight-two ratio, the win rate would be projected to plummet to 22.2%. But the wrinkle in all this is that even at 22.2%, the calculated EV would be $31, an ROC of 38.75%.
In other words, if you were to run this trade hundreds of times across parallel universes, you’d lose frequently. But of the times that you do win, you’ll collect a serious bag — big enough to likely overcome your prior losses.
Basically, as a speculative contrarian, most of your attention should be focused on the $25 spread. However, taking a small potshot at $30 wouldn’t be the most absurd idea.
On the date of publication, Josh Enomoto did not directly have a position in any of the securities mentioned in this article. All information and data in this article is solely for informational purposes. For more information please view the Barchart Disclosure Policy here.