
Gold.com (GOLD) Could Be 44% Undervalued Following Earnings And Dividend News
Gold.com earnings and dividend move put cash generation in focus
Gold.com (GOLD) just posted first quarter results that paired softer sales with a return to profitability, alongside a fresh quarterly dividend that keeps direct cash returns on the table for shareholders.
Recent trading in Gold.com has turned more cautious, with the share price falling 2.0% over the past day and 9.5% over the past month, while the 1-year total shareholder return of 49.2% and 3-year total shareholder return of 52.5% indicate that longer term holders have still seen strong gains.
Compare Gold.com’s mix of cash flow, lending and precious metals exposure with a curated set of resilient peers in our 29 resilient stocks with low risk scores to see how other low-risk operators stack up.
Gold.com now pairs a long-running precious metals franchise with a modest profit rebound and a fresh dividend, yet the share price has retreated sharply in recent weeks. Is this still a strong business priced on fair terms today?
Most Popular Narrative: 43.5% Undervalued
On the analyst consensus Narrative on Simply Wall St, Gold.com’s fair value sits at $64.40 versus a last close of $36.40. This frames a wide valuation gap while anchoring the thesis on revenue forecasts, earnings power and an 8.03% discount rate.
The recent string of acquisitions that have been folded into Gold.com, including Sunshine Mint, SGI, Pinehurst, AMS, Monex and others, has already taken reported FY2026 revenue to $25.5b and materially lifted production capacity, so further integration, cross selling and operational efficiencies across this larger platform can still flow through to higher net margins and earnings power.
See why 16 investors see Gold.com as 43% undervalued.
Result: Fair Value of $64.40 (UNDERVALUED)
Still, the story breaks if margin pressure persists while new direct to consumer customers keep dropping, because that would challenge Gold.com’s scale driven thesis.
Find out about the key risks to this Gold.com narrative.
Another view on Gold.com’s value
The first take paints Gold.com as 43.5% undervalued on analyst fair value estimates. A second lens, the SWS DCF model, is far more conservative and puts future cash flow value at $12.85 versus a market price of $36.40, which implies the shares screen as expensive on that framework. Which signal do you put more weight on for your own process?
For readers who want to unpack the cash flow assumptions in more detail, it helps to walk through the full calculation step by step, then compare it with your own expectations for volumes, margins and reinvestment needs, Look into how the SWS DCF model arrives at its fair value.
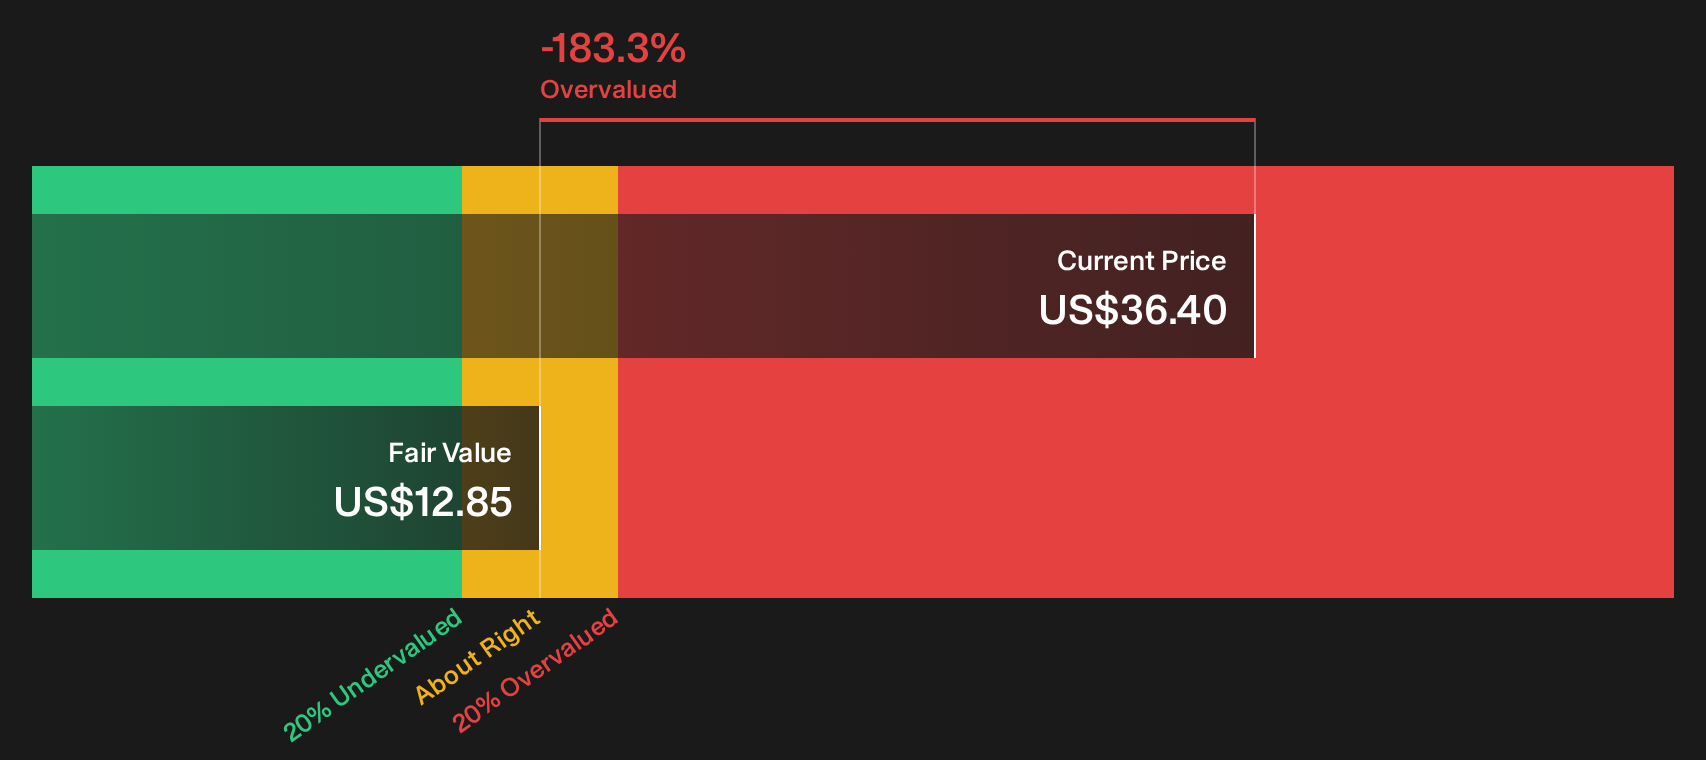
Simply Wall St performs a discounted cash flow (DCF) on every stock in the world every day (check out Gold.com for example). We show the entire calculation in full. You can track the result in your watchlist or portfolio and be alerted when this changes, or use our stock screener to discover 32 high quality undervalued stocks. If you save a screener we even alert you when new companies match - so you never miss a potential opportunity.
Next Steps
Mixed signals around Gold.com’s value story can be useful, but only if you stress test them against your own assumptions and risk tolerance. To map out both sides of that debate quickly, start with the 4 key rewards and 4 important warning signs.
Looking for more investment ideas beyond Gold.com?
If Gold.com has sharpened your focus on valuation and risk, do not stop there. A broader watchlist can help you spot opportunities earlier.
- Target fresh upside potential by scanning the 20 high quality undiscovered gems that pair solid fundamentals with under-the-radar stories.
- Strengthen your income stream by reviewing the 6 dividend fortresses that concentrate on companies offering higher yields with sturdy payout records.
- Prioritise resilience by filtering for the list of solid balance sheet and fundamentals (23 results) so you can focus on businesses with stronger financial footing.
Have feedback on this article? Concerned about the content? Get in touch with us directly. Alternatively, email editorial-team@simplywallst.com