
Is Hawkins (HWKN) Fully Valued After Its Recent Run Or Still Below Fair Value?
Hawkins (HWKN) has quietly drawn investor attention after a solid run, with the stock up about 15% over the past month and past 3 months, prompting fresh questions about what is driving that momentum.
Context over a longer stretch matters here. While the 30 day and 90 day share price returns are both around 15%, the year to date share price move is closer to 4%, and the 1 year total shareholder return of about 19% sits on top of a very large 5 year total shareholder return near 3.5x.
Scan beyond Hawkins to compare this recent momentum with handpicked industrial and materials peers by checking the 29 resilient stocks with low risk scores that pair resilience with historically steadier return profiles.
After a sharp move and a long track record of strong total returns, Hawkins now trades at a modest discount to both intrinsic estimates and analyst targets. Is that a genuine valuation gap, or is the market simply pricing in justified caution?
Price-to-Earnings of 36.4x: Is it justified?
Hawkins now trades on a P/E of 36.4x while the last close sits at $150.37, which points to a rich earnings multiple compared with both its own fundamentals and peers.
The P/E ratio captures how much investors are willing to pay today for each dollar of Hawkins earnings. For a chemicals and ingredients supplier with forecast earnings growth of 12.2% per year and high quality past profits, a higher P/E can signal that the market is paying up for consistency and visibility in cash generation rather than rapid expansion.
That premium is steep. Hawkins P/E of 36.4x is well above the US Chemicals industry average of 23.8x. It also sits higher than the estimated fair P/E of 17.1x that the SWS fair ratio model suggests the market could gravitate toward over time.
Explore the SWS fair ratio for Hawkins.
Result: Price-to-Earnings of 36.4x (OVERVALUED)
Still, Hawkins depends heavily on US demand and carries a P/E that leaves little room for disappointment if earnings growth or water treatment spending slows.
Find out about the key risks to this Hawkins narrative.
Another View on Hawkins Valuation
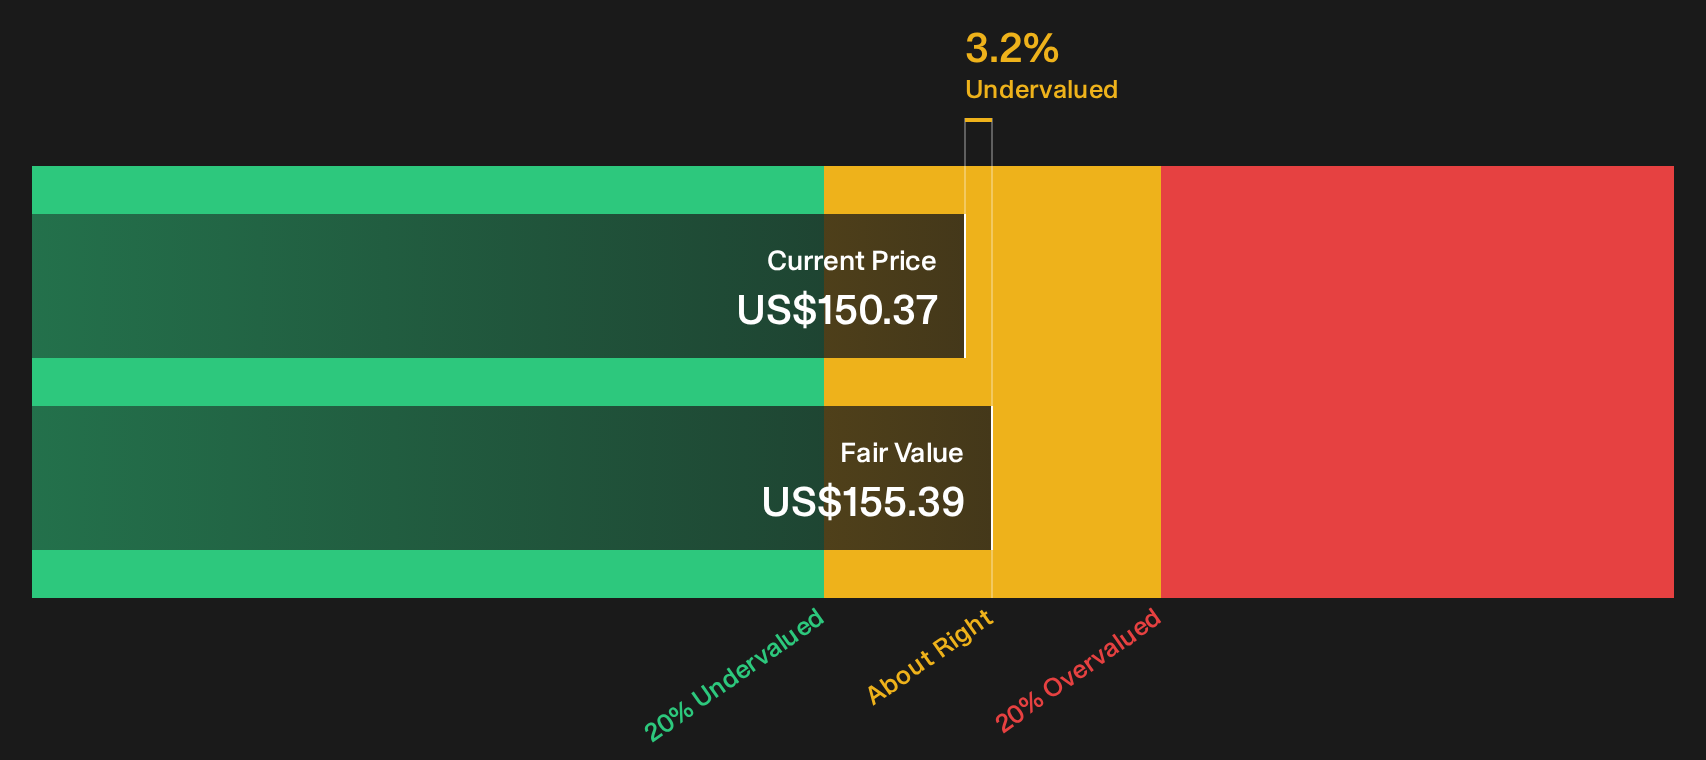
The P/E math paints Hawkins as expensive, yet the SWS DCF model points in a different direction. At $150.37, the stock is around 3.2% below an estimated future cash flow value of $155.39, which frames the current price as slightly undervalued instead of stretched.
Two methods, two stories. A rich earnings multiple and a modest discount to cash flow value pull in opposite directions and raise a key question: Is the market overpaying for recent consistency, or underestimating the durability of Hawkins cash generation?
Look into how the SWS DCF model arrives at its fair value.
Simply Wall St performs a discounted cash flow (DCF) on every stock in the world every day (check out Hawkins for example). We show the entire calculation in full. You can track the result in your watchlist or portfolio and be alerted when this changes, or use our stock screener to discover 32 high quality undervalued stocks. If you save a screener we even alert you when new companies match - so you never miss a potential opportunity.
Next Steps
Momentum cuts both ways, so do not let the recent excitement around Hawkins do all the thinking for you. Act while the data is fresh and weigh the upside and risks against your own tolerance, then round out that view by checking the 3 key rewards.
Looking for more ideas beyond Hawkins?
Once you have a view on Hawkins, widen the lens and pressure test your thinking against other opportunities that share similar quality or income traits.
- Target resilient upside by scanning a curated 20 high quality undiscovered gems list that filters for strong fundamentals and cleaner financial profiles than the broader market.
- Prioritise durability of capital by focusing on a list of solid balance sheet and fundamentals (23 results) that can better absorb shocks without forcing rushed capital raises or painful cutbacks.
- Lock in cash returns by reviewing a 6 dividend fortresses that screens for yields above 5% while still applying discipline on sustainability and balance sheet strength.
Have feedback on this article? Concerned about the content? Get in touch with us directly. Alternatively, email editorial-team@simplywallst.com