
Liquidity Services (LQDT) Could Be 18% Below Fair Value Following Its Sharp Run Up
Liquidity Services (LQDT) came onto investor radars after its recent share price move, with the stock closing at US$45.15. That shift has prompted fresh attention on the auction marketplace operator’s fundamentals.
Recent trading has been choppy, with the share price slipping 1.7% over the last session while still showing a 2.7% 30‑day share price return and a much stronger 52.6% year to date move, alongside a 94.3% 1‑year total shareholder return that signals strong momentum rather than fading interest in Liquidity Services.
Scan how Liquidity Services compares with other auction and asset-light platforms on our hand picked list of 20 high quality undiscovered gems.
After a near doubling in 12 months and a market value around US$1.4b, Liquidity Services is no longer a forgotten microcap. Do the current fundamentals still justify fresh money going in at this price?
Price-to-Earnings of 42.5x: Is it justified?
On simple earnings math, Liquidity Services looks expensive, with a P/E of 42.5x against a last close of $45.15. The key question for you is whether that earnings multiple reflects realistic expectations or asks too much of future performance.
The P/E ratio compares the current share price to earnings per share. For a business like Liquidity Services that operates digital marketplaces and software tools, investors often watch this metric closely because it captures how much they are paying for each dollar of profit today.
Here, the market is paying a much richer price for Liquidity Services than for the broader US Commercial Services industry, where the average P/E sits at 18.9x. That is more than double. It is also well above the peer group average of 27.8x, and the estimated fair P/E of 23.3x. The current valuation implies a much higher earnings multiple than the level suggested by that fair ratio, which is a level the market could move toward if sentiment cools.
Explore the SWS fair ratio for Liquidity Services.
Result: Price-to-Earnings of 42.5x (OVERVALUED)
Still, Liquidity Services faces real pressure points, including reliance on a few large revenue segments and the risk that high expectations could weaken if net income growth slows.
Find out about the key risks to this Liquidity Services narrative.
Another View: Liquidity Services Through A DCF Lens
The high P/E suggests Liquidity Services looks expensive on earnings, yet our DCF model points the other way. At $45.15, the stock trades about 17.7% below an estimated future cash flow value of $54.83. Which signal should matter more for you: price today or cash flows tomorrow?
Look into how the SWS DCF model arrives at its fair value.
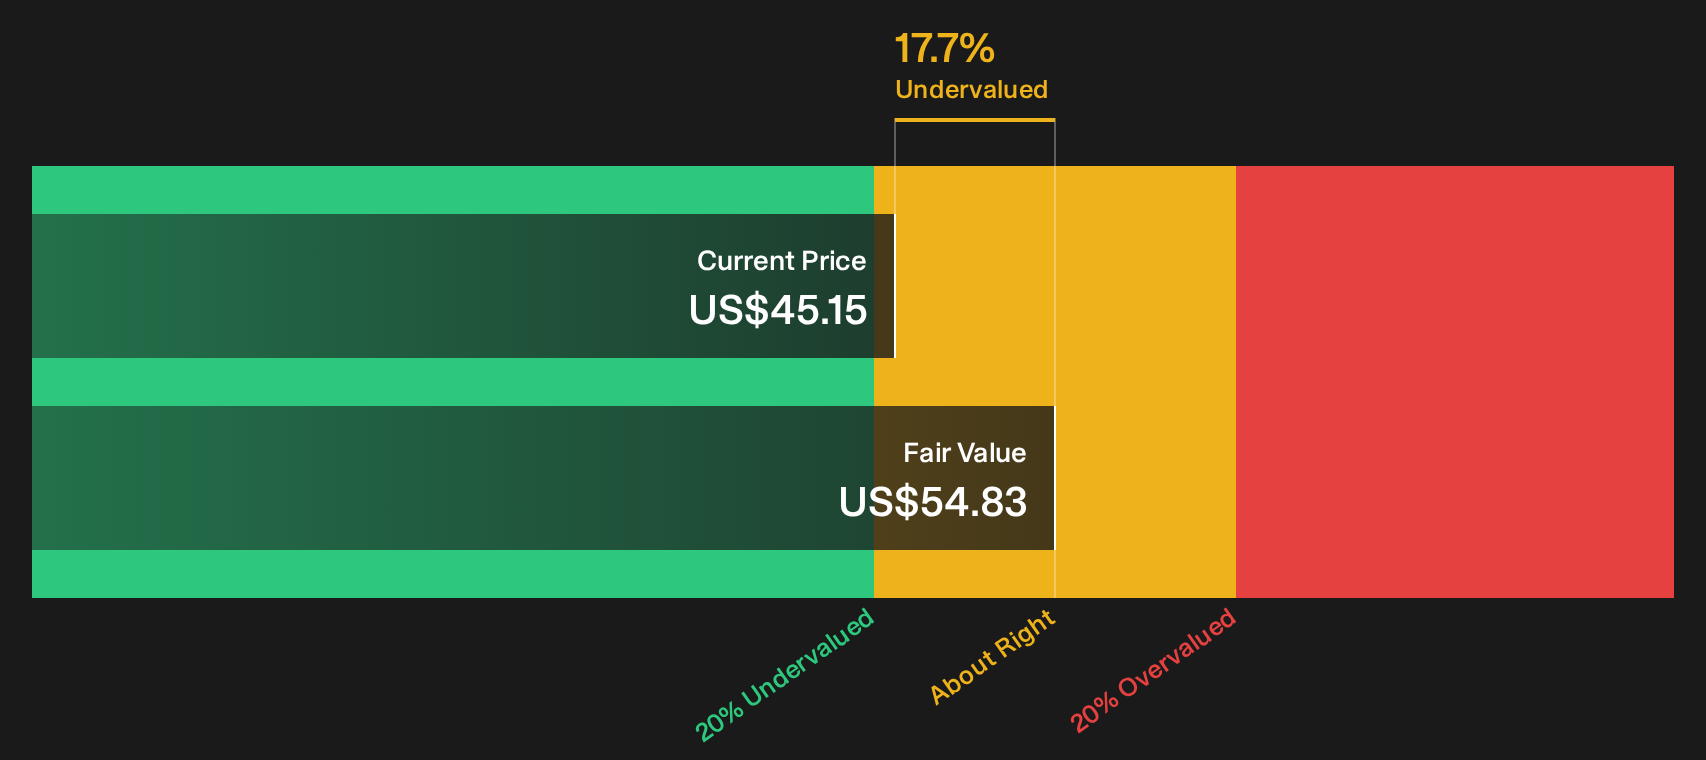
Simply Wall St performs a discounted cash flow (DCF) on every stock in the world every day (check out Liquidity Services for example). We show the entire calculation in full. You can track the result in your watchlist or portfolio and be alerted when this changes, or use our stock screener to discover 32 high quality undervalued stocks. If you save a screener we even alert you when new companies match - so you never miss a potential opportunity.
Next Steps
The mix of strong recent returns and a punchy P/E means opinions on Liquidity Services are likely split. If you want to move quickly and base your view on more than headlines, take a closer look at the 3 key rewards
Looking for more investment ideas beyond Liquidity Services?
If Liquidity Services has sharpened your focus on quality, do not stop here. Fresh opportunities often sit just outside your current watchlist.
- Target resilient returns by reviewing companies that score well on financial strength through our list of solid balance sheet and fundamentals (23 results).
- Hunt for mispriced potential and see which stocks currently screen as 32 high quality undervalued stocks.
- Prioritize sleep at night holdings by focusing on a set of 29 resilient stocks with low risk scores.
Have feedback on this article? Concerned about the content? Get in touch with us directly. Alternatively, email editorial-team@simplywallst.com