
Is Sharp (TSE:6753) Fully Valued On Weak Half Year Earnings?
Sharp (TSE:6753) landed back in focus after its H1 2027 earnings on 9 November, as weaker half year sales and much lower net income reset expectations and pressured recent share performance.
Sharp's share price closed at ¥516 on 11 November, with a 1-day share price return of 2.58%. This offered only a brief pause in what has been a weak spell that includes a 30-day share price return down 11.99% and a year-to-date share price return down 35.11%. Total shareholder return over 1 year and 5 years has fallen 38.28% and 60.21% respectively, pointing to fading momentum as the latest half-year earnings renewed concern about revenue pressure and profit volatility.
Compare Sharp's reset expectations with a curated list of companies that currently screen as 18 high quality undervalued stocks and see how the broader opportunity set looks next to this turnaround story.
Bulls see Sharp as an earnings reset on sale. Bears see a structurally pressured electronics group. Which story do the current valuation signals lean toward as you weigh this slump?
Preferred P/E of 26.2x: Is it justified?
On the numbers provided, Sharp trades on a P/E of 26.2x at a last close of ¥516, which looks rich when set against both its own profit profile and peers that carry lower earnings multiples.
The P/E ratio compares the share price to earnings per share and, for a mature electronics manufacturer like Sharp, it often reflects what investors are willing to pay today for each unit of current profit. A higher multiple usually implies the market is baking in steadier margins, cleaner earnings quality or stronger confidence in future profitability.
Here, the valuation looks demanding. Earnings over the past year declined sharply, profit margins slipped from 2.9% to 0.7%, and analysts see revenue eroding at roughly 2.8% per year while forecasting earnings growth of 16.5% per year. That mix suggests the market is placing a high price on expected profit recovery despite weaker top line trends and low current Return on Equity of 4.4%, which is well below the 20% threshold often associated with higher quality returns.
Peer checks only reinforce that picture. The current P/E of 26.2x is well above the JP Consumer Durables industry average of 9.8x and also above the estimated fair P/E of 18.5x. The current ratio therefore sits meaningfully higher than both sector norms and the level the regression based fair ratio implies the market could eventually move toward if expectations cool.
Explore the SWS fair ratio for Sharp.
Result: Price-to-Earnings of 26.2x (OVERVALUED)
Still, the Sharp story could shift quickly if revenue pressure in core segments deepens or if profit volatility makes that 26.2x P/E look fragile.
Find out about the key risks to this Sharp narrative.
Another view on Sharp using the SWS DCF model
A second lens tells a very different story. Our DCF model points to a future cash flow value of ¥369.23 per share, well below Sharp's current ¥516 quote. That gap suggests the cash flow based view leans to overvaluation rather than a bargain reset. Which signal carries more weight for you: earnings multiple or cash generation?
Look into how the SWS DCF model arrives at its fair value.
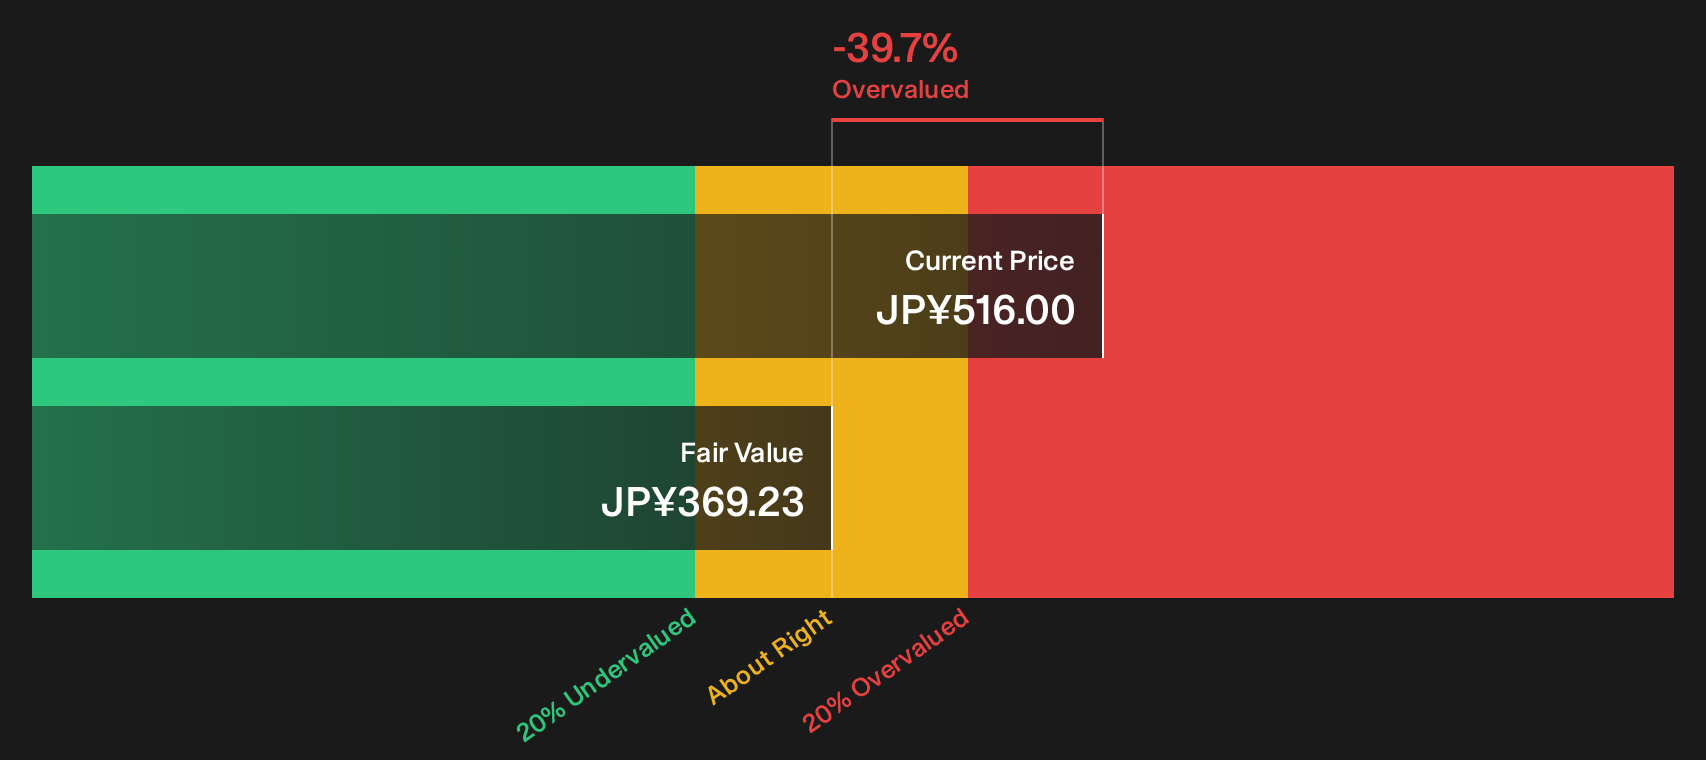
Simply Wall St performs a discounted cash flow (DCF) on every stock in the world every day (check out Sharp for example). We show the entire calculation in full. You can track the result in your watchlist or portfolio and be alerted when this changes, or use our stock screener to discover 18 high quality undervalued stocks. If you save a screener we even alert you when new companies match - so you never miss a potential opportunity.
Next Steps
Mixed signals around Sharp can feel messy, so move quickly from headline noise to your own verdict by weighing its 1 key reward against 1 key reward and 3 important warning signs.
Looking for more ideas beyond Sharp?
Do not stop your research with Sharp. Broader context across different business models, balance sheets and income profiles can sharpen how you judge this turnaround story.
- Spot potential bargain opportunities early by scanning companies that currently screen as 74 high quality undiscovered gems and compare their setup with what you see in Sharp.
- Prioritise resilience by weighing businesses that appear in the 20 resilient stocks with low risk scores against more volatile situations so you can choose your trade offs with intent.
- Anchor your watchlist around financial strength by filtering for companies in the list of solid balance sheet and fundamentals (25 results) and see which ones deserve a closer look next.
Have feedback on this article? Concerned about the content? Get in touch with us directly. Alternatively, email editorial-team@simplywallst.com