
Pershing Square (PS) Stock Looks Richly Priced After Its 82% Rally
Pershing Square has surged year to date, even after a recent pullback, which puts fresh attention on a simple question for investors who care about valuation: Is the current share price properly anchored in what the business is generating through its sales?
- The stock is up 81.9% year to date, which raises the stakes on whether today’s valuation can still be explained by the revenue it supports.
- Bill Ackman’s push around Fannie Mae and Freddie Mac, along with comments about exploiting market dislocations, may shape how investors think about the durability and timing of fee and performance-related income that ultimately drives Pershing Square’s top line.
- Your read on Pershing Square is one view; the desks covering it have another. See what analysts think Pershing Square's shares could be worth.
The issue now is whether the recent share price level can be squared with Pershing Square’s sales when stacked against the Fair Ratio benchmark.
If this Pershing Square move has you rethinking what you pay for each dollar of sales, a focused stock screen built around 32 high quality undervalued stocks can be a clean next starting point for research.
Has Pershing Square Run Too Far on Sales?
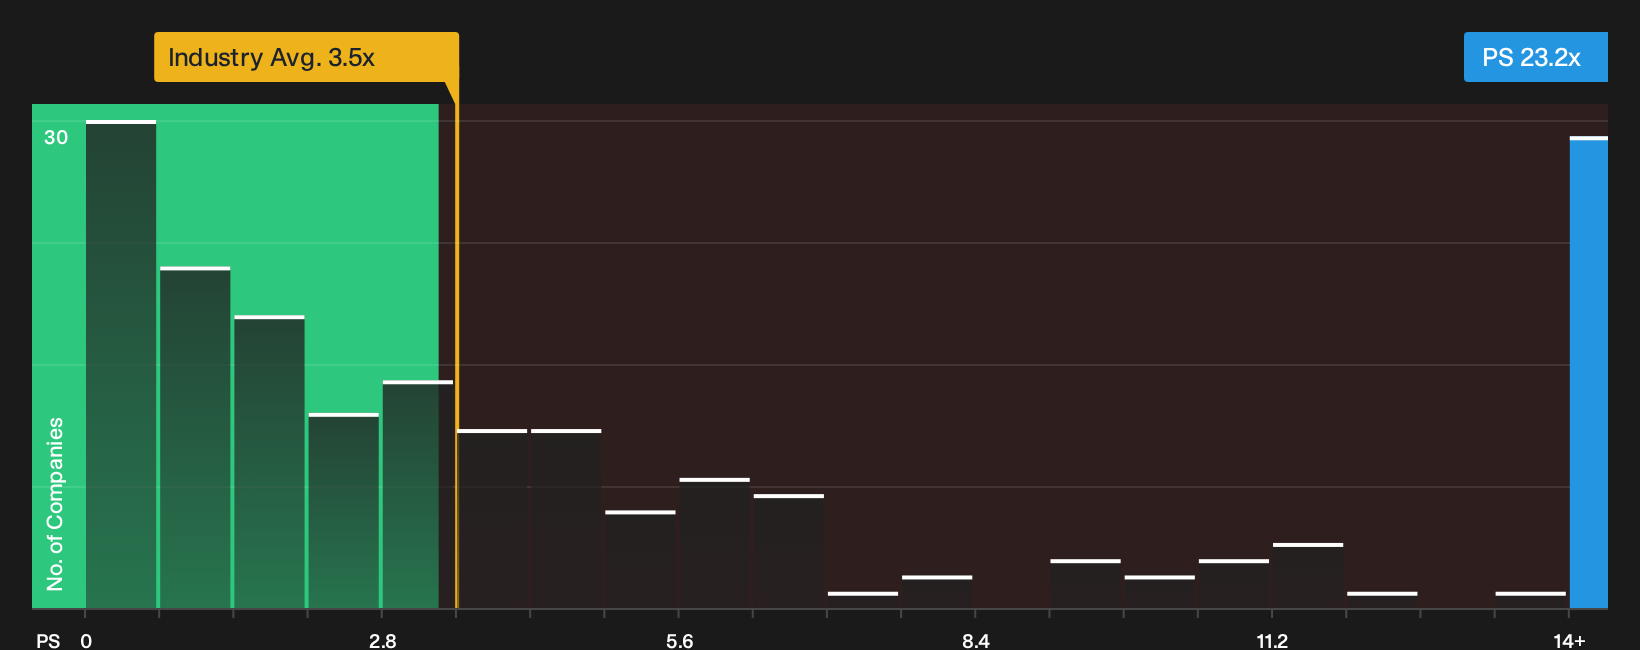
P/S fits Pershing Square because investors often focus on the stability and scalability of fee revenue rather than short term earnings noise. The stock currently trades on a P/S ratio of 23.2x, against a Capital Markets industry average of 3.5x and a peer group around 3.0x, so buyers today are paying a far richer price per dollar of sales than is typical in this corner of the market.
Bill Ackman’s push around Fannie Mae and Freddie Mac has sharpened the story, yet even with that catalyst the P/S still screens as overvalued relative to a Fair Ratio that already bakes in the firm’s business mix, risk profile and scale. The model is heavily penalising Pershing Square’s earnings quality and volatility, which turns the gap between the current multiple and that tailored benchmark into more of a caution flag than a precise pricing target. For anyone weighing whether the rally has overshot on sales, the next step is to see how that Fair Ratio was calculated and what assumptions drive the spread. Explore the numbers behind Pershing Square's P/S valuation.
The Pershing Square Narrative: What Would Justify Today's Price?
Pershing Square's sharp P/S premium sets up a clear puzzle, and Simply Wall St Narratives act as the link between that number and the future business path it implies. Narratives spell out which combinations of growth, profitability and earnings power would need to occur for the shares to be worth meaningfully more or less than today’s level, and where a single ratio or model outputs one figure, these unpack the future that figure relies on so you can monitor whether it is playing out.
One of the top narratives on Pershing Square: 17% undervalued
This Narrative is the bullish analyst Narrative on Simply Wall St, built on the most optimistic analyst price target and forecasts, not one person's view.
"Concentrated ownership of what Pershing Square views as high quality, cash generative companies such as Amazon, Meta, Microsoft and Netflix gives the firm direct exposure to large scale adoption of cloud computing and artificial intelligence…"
Discover why this Narrative puts Pershing Square at 17% undervalued.
Pershing Square’s price is only one question to answer
Valuation tells you what you are paying, but it does not tell you everything you might be accepting in the process, and Pershing Square still has specific risk checks that deserve a closer look. Take a closer look at 1 warning sign before settling on a valuation.
Have feedback on this article? Concerned about the content? Get in touch with us directly. Alternatively, email editorial-team@simplywallst.com