
Andersen Group (ANDG) Lifted Guidance And Added Acquisitions, Is It Still Undervalued?
Andersen Group (ANDG) is back in focus after reporting third quarter 2026 revenue of $337.3 million, with management pairing 18.7% top-line growth, eight completed acquisitions, and fresh 2027 guidance in one update.
That backdrop has been reflected in Andersen Group’s trading pattern, with the share price at $65.42 after a small 1 day pullback of 0.64%, a 30 day share price return of 14.19%, a 90 day gain of 33.81%, and a year to date share price return of 168.33%, indicating strong upward momentum that recent guidance and acquisition activity may be reinforcing in investors’ minds.
Surf 20 high quality undiscovered gems that, like Andersen Group, are using acquisitions and fresh guidance to fuel rapid top-line momentum.After a move this sharp on the back of acquisitions and fresh guidance, Andersen Group now faces a simple test: Does the current price still leave enough upside to justify the risk?
Price-to-Earnings of 28.4x: Is it justified?
On the surface, Andersen Group trades on a P/E of 28.4x, which is a rich tag for a stock that closed at $65.42, yet the valuation story gets more nuanced once you compare that multiple to both peers and a fair value estimate.
The P/E ratio compares the current share price to earnings per share and, for a service heavy business like Andersen Group, it is a quick way to see how much investors are paying for each dollar of profit.
At 28.4x, investors are paying more than the Professional Services industry average of 22.7x, which points to a premium sticker price, but that same P/E sits below an estimated fair P/E of 35.8x, which indicates the stock is trading below the level implied by that fair ratio, assuming earnings forecasts and cash flow expectations are met as modeled.
Explore the SWS fair ratio for Andersen Group.
Result: Price-to-Earnings of 28.4x (UNDERVALUED)
Still, the Andersen Group story can fray if acquisition integration drags on margins, or if any shift in tax regulation softens demand for its advisory work.
Find out about the key risks to this Andersen Group narrative.
Another view on Andersen Group’s value
Price tags based on earnings tell one story, but the SWS DCF model tells another. On that cash flow view, Andersen Group at $65.42 sits about 13% below an estimated value of $75.51, which frames the current quote as undervalued. Which lens do you rely on when real money is on the line?
Look into how the SWS DCF model arrives at its fair value.
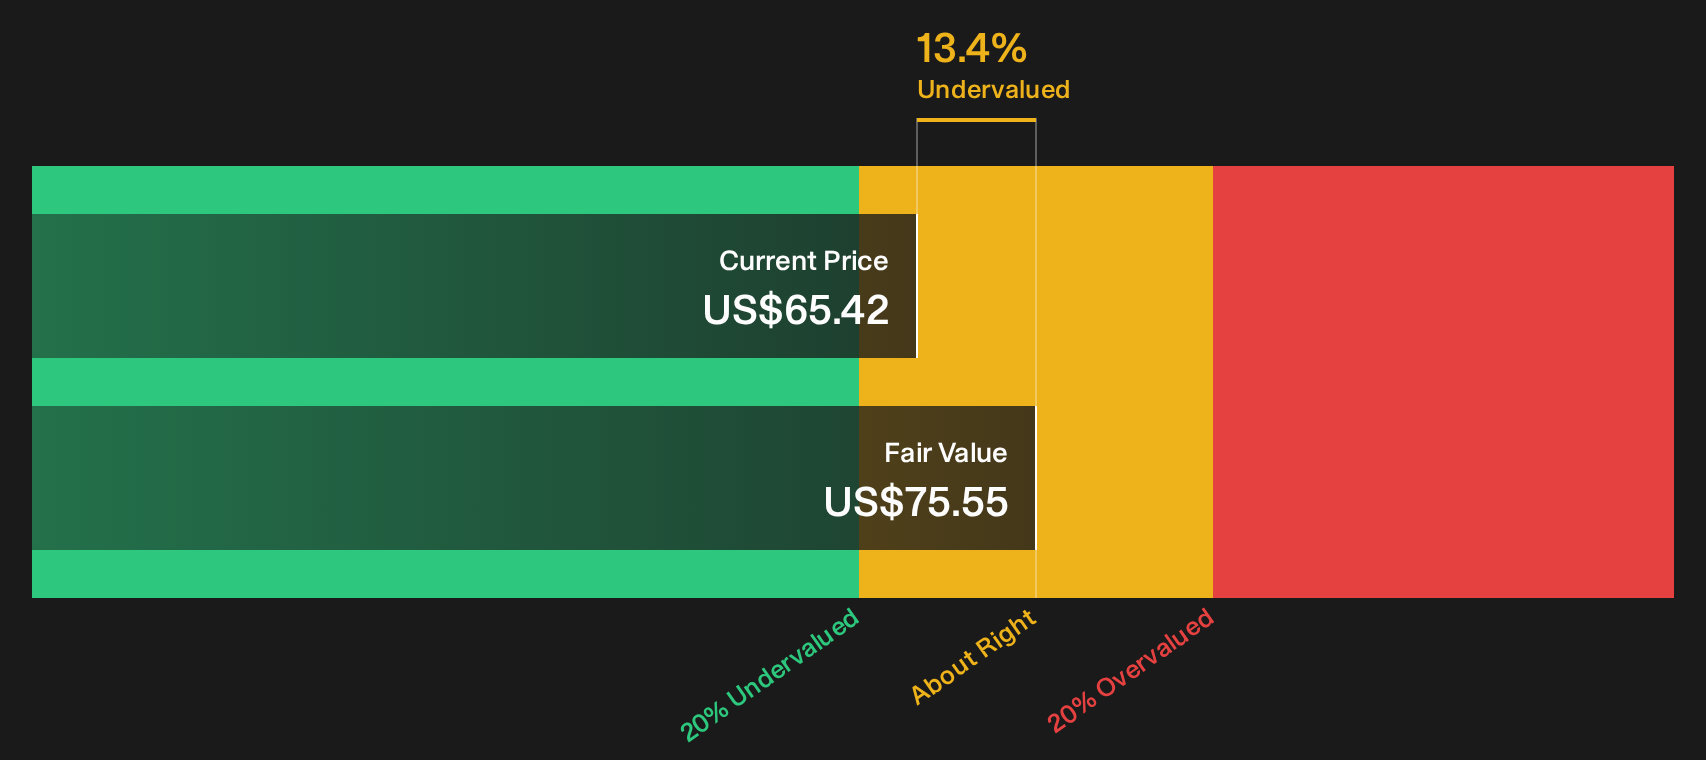
Simply Wall St performs a discounted cash flow (DCF) on every stock in the world every day (check out Andersen Group for example). We show the entire calculation in full. You can track the result in your watchlist or portfolio and be alerted when this changes, or use our stock screener to discover 31 high quality undervalued stocks. If you save a screener we even alert you when new companies match - so you never miss a potential opportunity.
Next Steps
Mixed signals across Andersen Group’s valuation and risk profile make this a decision point, so move quickly, review the data yourself, and weigh the 3 key rewards and 2 important warning signs
Hunting for more ideas beyond Andersen Group?
If Andersen Group has sharpened your focus, do not stop here. Broaden your watchlist now so you are not chasing the next move late.
- Target resilient compounding potential by checking companies screened for dependable payouts and sturdy metrics through the 6 dividend fortresses.
- Zero in on mispriced quality by scanning the 31 high quality undervalued stocks that pair solid fundamentals with pricing that may not fully reflect them yet.
- Protect your downside first by reviewing a 29 resilient stocks with low risk scores that highlights businesses with lower risk profiles and more robust financial footing.
Have feedback on this article? Concerned about the content? Get in touch with us directly. Alternatively, email editorial-team@simplywallst.com