
Where is the bottom of the gold price? World Gold Council: Three bottoming conditions have been met, and two speculative positions still need to be cleared
The Zhitong Finance App learned that the World Gold Council published an article stating that at the end of October, the price of gold closed at 3,913 US dollars/ounce, down 6.3% from the previous month. Gold prices rarely changed in the same direction as US bond yields. Due to the contraction of speculative total holdings, the COMEX managed fund's net long position decreased by about US$7 billion (53 tons) in October. According to the model, the three conditions for judging that the price of gold has bottomed out have now been met: the price of gold is far below the 200-day moving average, and the strengthening of the US dollar has entered a high range. However, speculative positions are still high. The speculative bubble has not completely dissipated, and speculative futures positions still need to be further cleared before the price of gold can rise for a longer period of time.
When leverage is low
At the end of October, the price of gold closed at 3,913 US dollars/ounce, down 6.3% from the previous month. The price of gold in all major currencies fell.
Our short-term gold price performance attribution model (GRAM) shows that declining US bond yields supported gold in October.
However, gold prices and US bond yields rarely changed in the same direction during the month, which cannot be explained by the model, or driven by three major factors:
The market is repricing expectations for the Fed's interest rate path
The contraction of speculative total holdings
As the stock market declined and credit spreads widened, capital temporarily shifted from stocks and gold to bonds. Most sales are likely to be dominated by the derivatives market.
The net long position of funds managed by the New York Mercantile Exchange (COMEX) decreased by about $7 billion (53 tons) in October, after an even greater decline in September.
The decline in the total number of open contracts was even more pronounced. The net long unreported position volume and net spread trading positions both declined in the last week of October — this is one reason for the model's negative residuals.
Despite the fall in gold prices, global gold ETFs still had a net inflow of around $3 billion (19 tons).
Among them, Europe led the way, followed by Asia, and a small net outflow from North America.
The transfer of capital to bonds, compounded by outflows from North American gold ETFs and
COMEX futures holdings declined, jointly driving the decline in gold prices
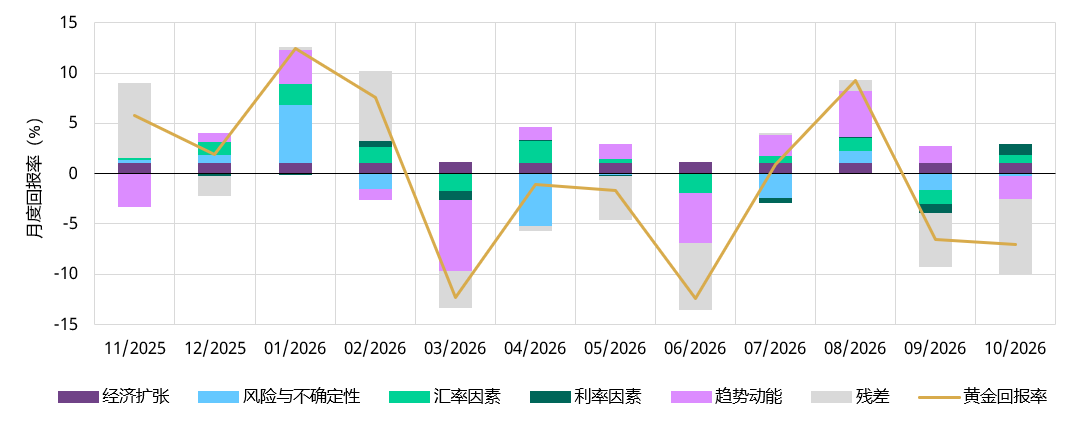
Gold rebounded in early November as the dust settled in the US midterm elections with unexpected results, and the market re-priced various policies such as US finance and AI regulation.
However, the market's expectations for the future interest rate path of the Federal Reserve changed with the release of economic data one after another, and still had a significant impact on the short-term trend of gold.
At the same time, there is still great uncertainty about the actual implementation and impact of various policies after the midterm elections, and we will continue to observe the impact on gold.
Where is the bottom of the gold price?
Spot gold prices fell about 25% from their all-time high in January. Investors have been asking: is the price of gold about to bottom out soon?
For many commodities, the economics of primary supply may provide part of the answer, but this is not the case with gold. Fair value estimates may provide a useful reference, but like stocks, fair value is not an effective timing tool.
So instead of trying to determine the exact bottom point, we are asking this question:
Judging from history, when gold rebounds in a downward trend, what conditions are usually in place?
We focused on studying the pullback phase of the past 20 years, that is, the period when the 50-day moving average of gold remained below the 200-day moving average for at least a month, and tested a series of candidate indicators. Three of these were particularly prominent, reflecting the different characteristics of the sell-off market. For each indicator, the signal is triggered when the reading is in the extreme 30% range of each month's pullback:
Price deviation: The price of gold is far below its 200-day moving average to measure the extent to which the market has overfallen.
The US dollar is stronger: The US dollar index (DXY) is significantly higher than in the past 52 weeks. When the fall in gold prices is driven by a sharp rise in the US dollar, the weak trend is often temporary, reflecting changes in exchange rates rather than weakening demand for gold.
Liquidation of positions: Speculative futures positions (including those of managed funds and small traders) fell to an abnormally low level compared to the total number of unclosed contracts. A recovery in the price of gold requires momentum, and when speculators with less firm positions complete the sell-off, there will be fewer potential sellers left.
Looking at the indicator that the price of gold is significantly lower than the trend level, there is some reference value for predicting future market performance, but it is not perfect. When the sell-off was accompanied by a sharp rise in the dollar and the liquidation of speculative positions, future returns improved markedly.
According to historical cases, when all three conditions are met, the price of gold shows an upward trend after three months. However, the sample size was small, only five times. However, as long as at least two of the three conditions are met, it can also provide some confidence that positive returns will be recorded in the future.
The bottom of the gold price is up to you to judge
Analysis of indicator performance since 2005
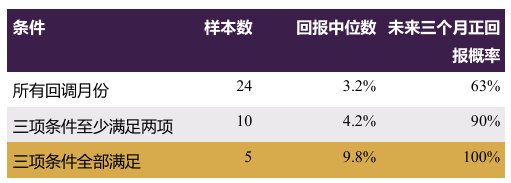
Has the price of gold bottomed out?
At present, two of the three conditions have been met: the price of gold is far below the 200-day EMA, and the strengthening of the US dollar has entered a high range.
However, speculative positions remain high. The speculative bubble has yet to completely dissipate. Consistent with previous pullbacks, speculative futures positions still need to be further cleared before the price of gold can rise for a longer period of time.
Three satisfies two, and the situation is OK
Gold price, pullback stage and indicator level
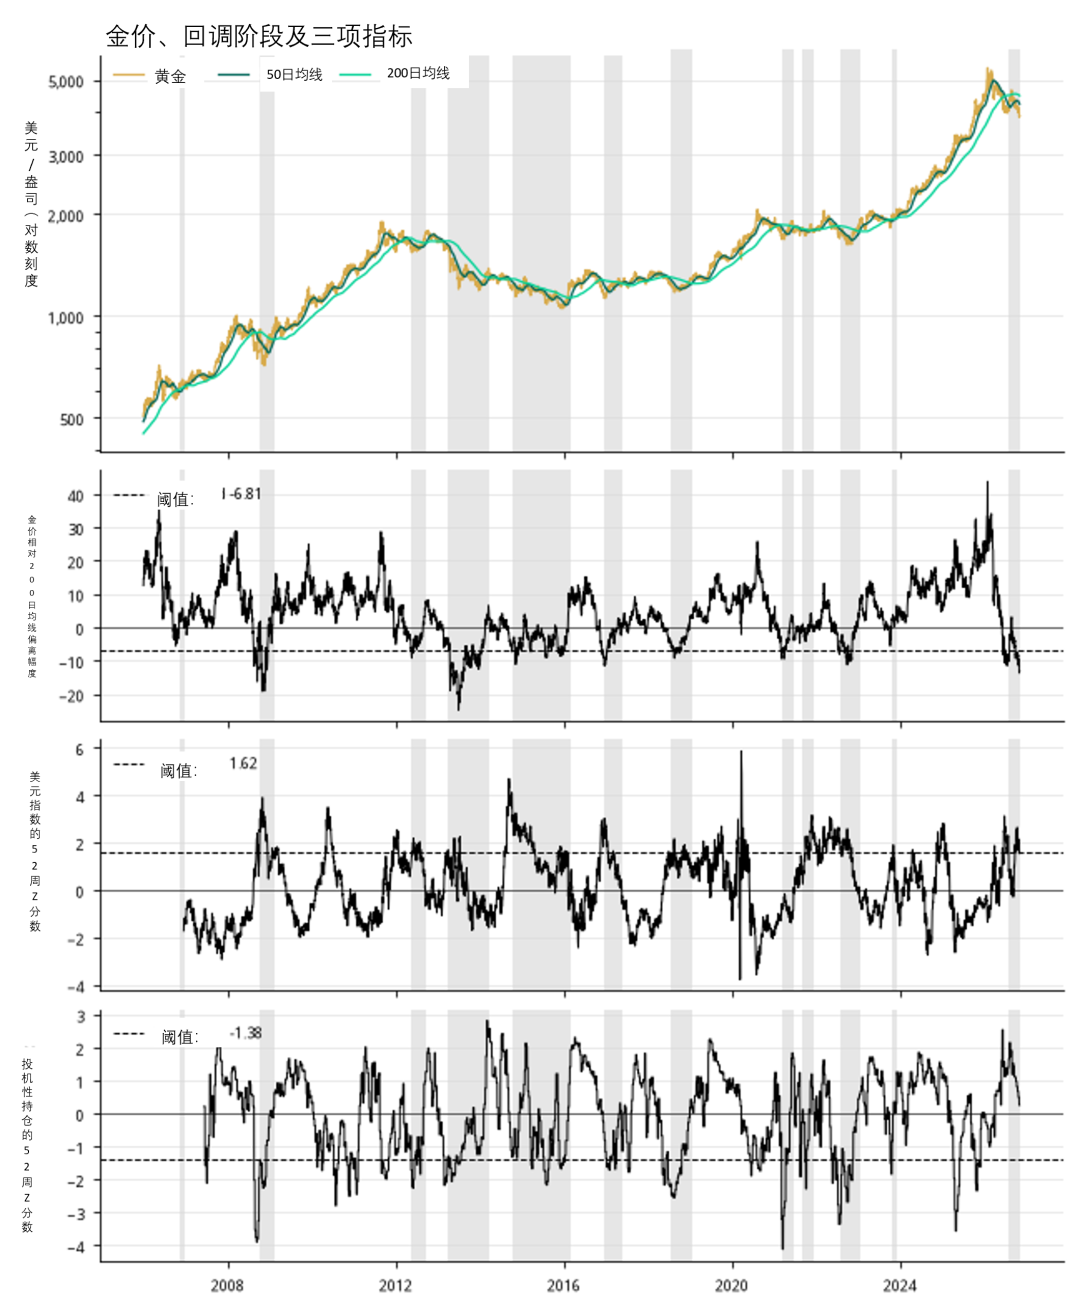
While indicators are useful, background factors are more critical
This framework only measures the market for the next three months, and cannot predict a one-year trend or whether it can restart a lasting upward trend — that depends on the broader strategic allocation logic of gold.
In this regard, the macroeconomic and fundamental context is probably even more important. Some investors might compare the current situation to the high of 2011. But we don't think this analogy is appropriate. The sell-off, which continued for many years after 2011, occurred in an environment that was more unfavorable to gold.
Based on the fundamental background, the current market is more likely to be a pullback than the beginning of a long-term downward trend. Despite this, our simple framework indicates that not all of the relevant conditions have been met. Although many factors still tend to favor gold in the medium term, there may still be changes unfavorable to gold prices in the short term, especially considering the risk of events that may be caused by policy decisions and geopolitical factors in the fourth quarter.
For investors who are still on the market, a sign to watch out for is the further clearing of speculative positions. If the other two conditions are still true when this signal appears, then the current market will coincide with the historically attractive time for gold to enter the market.
Other technical indicators also convey similar information
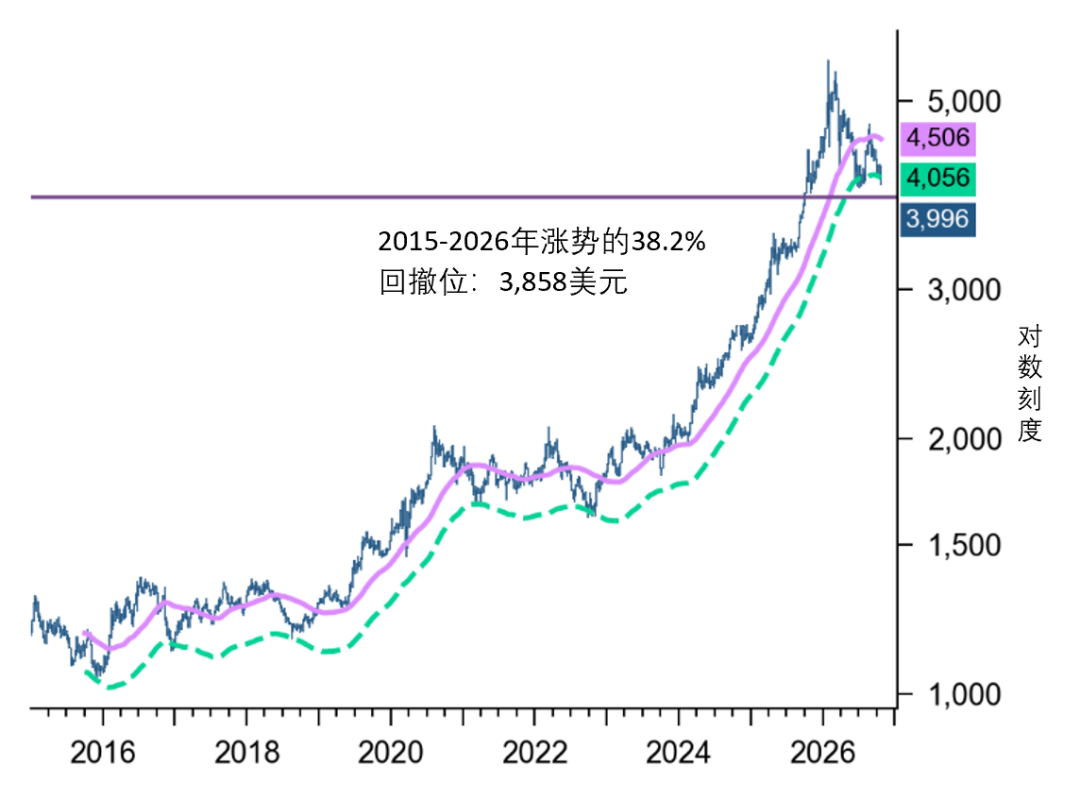
On the technical side, the price of gold has fallen to what we usually consider to be an “extreme” downward level, 10% below the 200-day moving average, but still above the support level of $3,857 per ounce. This support level corresponds to the 38.2% Fibonacci retracement level of the entire round of gold price gains since 2015.
This shows that judging from the current price level and technical state of the gold price, it is already possible to pay attention to signals that indicate the formation of a potentially important bottom. However, as trend momentum is still weakening, it still seems too early to judge the bottom. This means that the price of gold may still drop by $3,857 per ounce, but this price is likely to be an attractive entry point for investors .
Close to an attractive price
The 10% envelope below the price of gold and the 40-week EMA
Summarize
This framework is not a trading rule, but a simple judgment method. Based on a few historical cases, the next three months are used as the observation period to determine whether a round of sell-off begins to show signs of excessive decline.
The framework shows that the conditions for a rebound in gold prices are gradually accumulating, but not all are in place. The broader market environment suggests that the current market is more likely to be a correction than a repeat of the downward trend after 2011 — some investors tend to compare the two.
For the rest of 2026, the risk of events may still drive the price of gold up and down, and the policy results brought about by the US midterm elections are likely to be a key factor. If the stock and credit markets weaken further, the appeal of US Treasury bonds may increase, and the situation we have seen in the past few weeks is directly correlated with the rare yield rate of gold. But this presupposes that inflationary pressure subsides, and it is unclear whether inflation will fall back.
For strategic investors, the annual return of gold since 1971 is close to 9%. Judging from historical experience, buying in batches at low prices is a reasonable practice. Therefore, the more meaningful question is not where the bottom of the gold price is, but rather whether weakening gold prices are gradually becoming a more attractive opportunity to increase holdings.