
Spectrum Brands’s Q3 CY2026 earnings results: Revenue in line with expectations

Household products company Spectrum Brands (NYSE:SPB) met Wall Street’s revenue expectations in calendar Q3 2026 [fiscal Q4 2026], but revenue fell by 2.8% year on year to $713.2 million. Its non-GAAP profit of $1.39 per share was 53.7% above analysts’ consensus estimates.
For more on Spectrum Brands, read the full research report for free.
Spectrum Brands Q3 CY2026 highlights:
- Revenue $713.2 million vs analysts' consensus estimates of $714.9 million, according to S&P (2.8% year-on-year decline, in line)
- Adjusted EPS $1.39 vs analysts' consensus estimates of $0.90, according to S&P (53.7% beat)
- Adjusted EBITDA $69.9 million vs analysts' consensus estimates of $61.66 million (9.8% margin, 13.4% beat)
- Operating margin 3.4%, in line with the same quarter last year
- Free cash flow margin 15.3%, down from 21.5% in the same quarter last year
- Organic revenue fell 3.1% year on year (miss)
- Market capitalization $2.03 billion
"We are pleased with our fiscal 2026 results, with Global Pet Care and Home & Garden both returning to top-line growth, and our key brands continuing to outperform the market across both businesses. In Home & Personal Care, while top-line pressures persisted as expected, the team delivered strong margin expansion, a direct reflection of disciplined execution and a clear focus on profitability. The underlying performance across all three segments demonstrates the strength of our business fundamentals. Balance sheet health remains a priority, and our strong financial position gives us the flexibility to invest in the business and pursue strategic opportunities as they arise. We are entering fiscal 2027 with momentum, and we expect net sales and adjusted EBITDA to both be flat to up low single digits, normalizing for the tariff refund benefit received this year," said David Maura, Chairman and Chief Executive Officer of Spectrum Brands.
Revenue growth
Examining a company’s long-term performance can provide clues about its quality. Any business can put up a good quarter or two, but the best consistently grow over the long haul.
With $2.85 billion in revenue over the past 12 months, Spectrum Brands carries some recognizable products but is a mid-sized consumer staples company. Its size could bring disadvantages compared to larger competitors benefiting from better brand awareness and economies of scale.
Spectrum Brands struggled to increase demand as its $2.85 billion in revenue for the trailing 12 months was close to its revenue three years ago. This shows demand was soft.
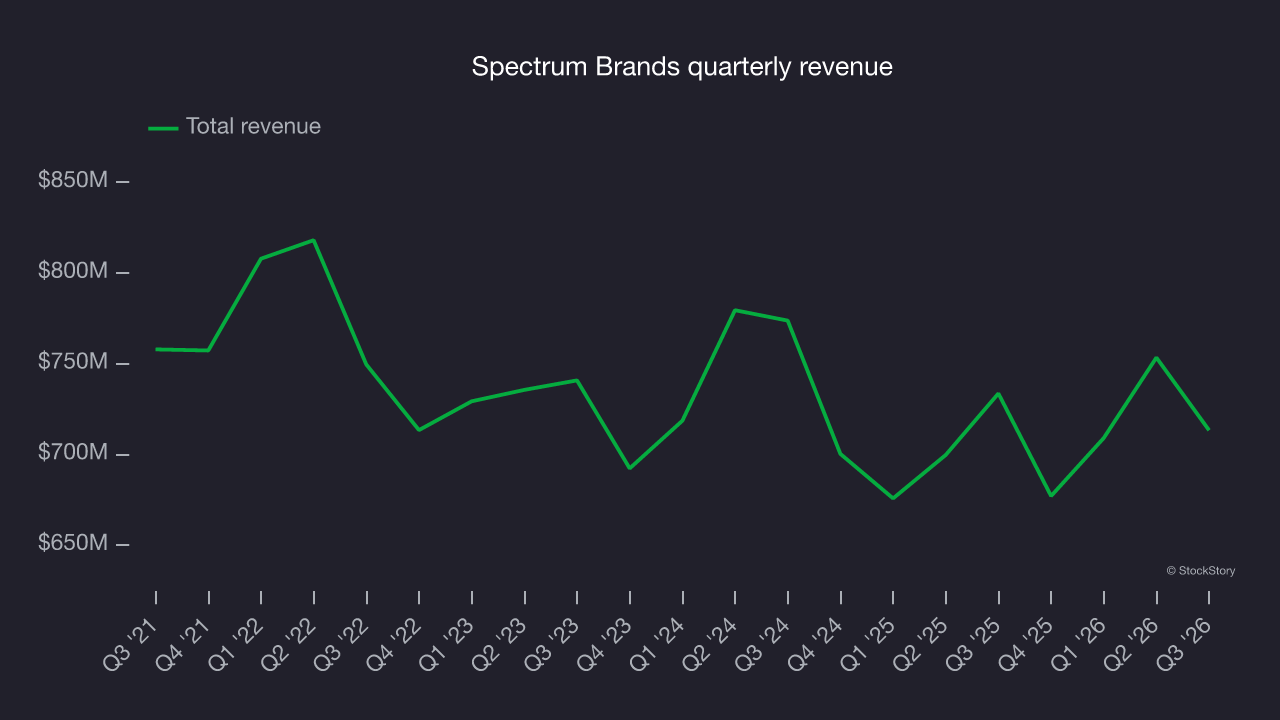
This quarter, Spectrum Brands reported an uninspiring 2.8% year-on-year revenue decline to $713.2 million, in line with Wall Street’s consensus estimates.
Looking ahead, sell-side analysts expect revenue to grow 1% over the next 12 months, according to S&P. While this projection suggests its newer products will improve revenue performance, it is still below average for the sector.
Organic revenue growth
The most important metric for analyzing revenue growth is organic revenue growth. This metric captures a business’s performance excluding one-time events such as mergers, acquisitions and divestitures as well as foreign currency fluctuations.
Spectrum Brands’s demand has been falling over the last eight quarters, and on average, its organic revenue has declined by 2.1% year on year. 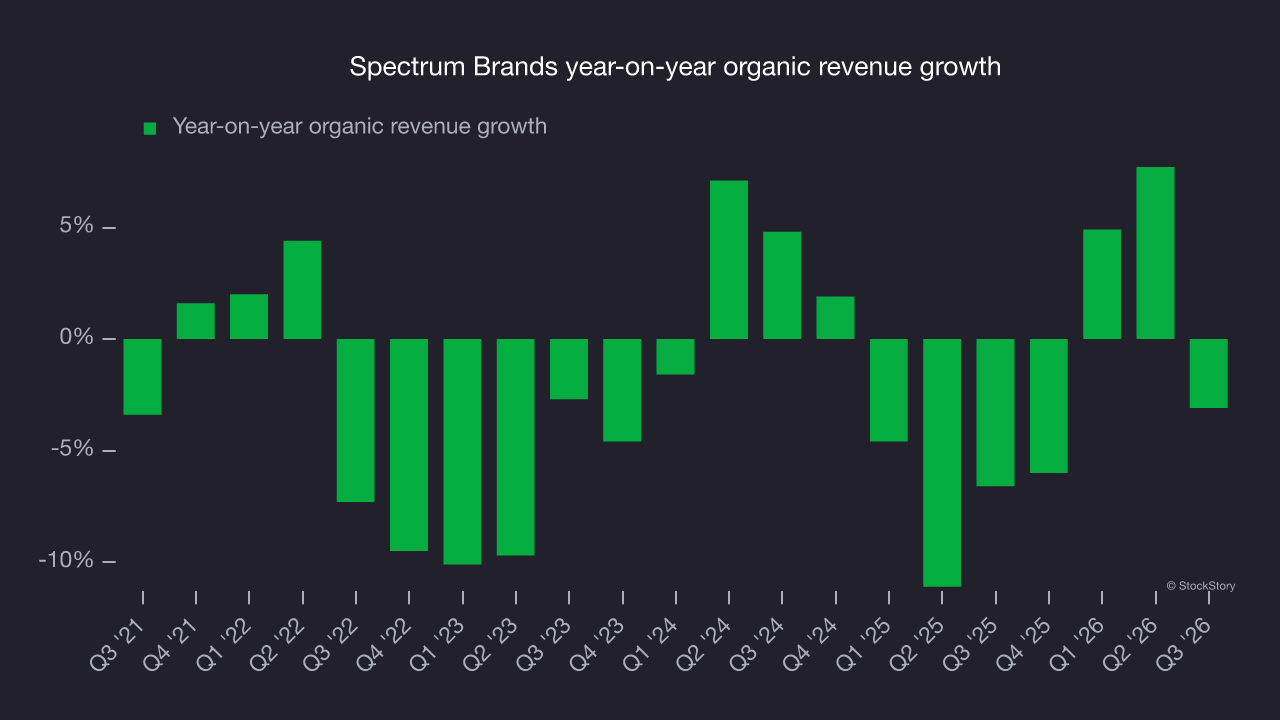
In the latest quarter, Spectrum Brands’s organic revenue fell by 3.1% year on year. This performance was more or less in line with its historical levels.
Key takeaways from Spectrum Brands’s Q3 results
A wide EBITDA beat and EPS above analysts’ consensus estimates gave Spectrum Brands’ quarter some clear positives, but organic revenue fell slightly short of expectations. It was still a solid quarter overall. Shares remained flat at $88.28 immediately after the release.
To assess Spectrum Brands as an investment, consider its valuation, business quality and latest quarterly results. Read the full research report here (it’s free).