
ULVAC (TSE:6728) Dropped, So What Is Behind The Attention Now?
Investor attention around ULVAC (TSE:6728) has intensified after the Q1 2027 earnings call on 10 November, which was held alongside a board meeting to consider revising the company’s earnings forecasts.
At a share price of ¥7,051, ULVAC has swung sharply in recent months, with the stock down 17.16% on a 30 day share price return and 24.75% on a 90 day share price return. This comes even though the 1 year total shareholder return sits at 2.34% and the 3 year total shareholder return is 15.27%, which suggests recent weakness has come as investors reassess risk and earnings expectations around the Q1 2027 results and the potential revision to forecasts.
Scan how ULVAC compares to other chip and equipment plays under pressure by reviewing our curated list of 87 robotics and automation stocks in related manufacturing and automation niches.
Bulls view ULVAC’s recent share price slide as a reset that leaves solid earnings growth available at a more attractive price. Bears see it as a warning signal that highlights forecast risk. The key question is which side the current valuation appears to support.
Price-to-Earnings of 16.4x: Is it justified for ULVAC?
On the latest figures, ULVAC trades on a P/E of 16.4x, which lines up with a share price of ¥7,051 and suggests investors are paying a moderate premium for each yen of earnings compared with some peers.
The P/E ratio links the current market value of the equity to its trailing profit. It effectively tells you how much investors are willing to pay for ULVAC’s current earnings power. For semiconductor equipment makers, this gauge often reflects expectations around the durability of profit cycles and how confident the market is that today’s earnings can be sustained.
For ULVAC, that 16.4x multiple sits slightly above the immediate peer average of 15.5x. This points to the market assigning a small premium to this stock relative to close comparables. It is still below the broader JP semiconductor industry average of 17.1x, and it sits under the estimated fair P/E of 17.6x, which is a level the ratio could gravitate toward if current assumptions hold.
Explore the SWS fair ratio for ULVAC.
Result: Price-to-Earnings of 16.4x (ABOUT RIGHT)
Still, ULVAC faces clear risks if sector demand softens or vacuum equipment orders slow, which could pressure earnings resilience and challenge the current P/E premium.
Find out about the key risks to this ULVAC narrative.
Another View on ULVAC’s Value
The P/E ratio presents ULVAC as roughly in line with its sector, yet the SWS DCF model points in the opposite direction. On that cash flow view, the shares at ¥7,051 trade above an estimated value of ¥5,125.38, which frames the stock as overvalued rather than fairly priced.
Both methods use the same financials but tell different stories. For an investor, that gap is a question about which set of assumptions feels more realistic for ULVAC’s future cash generation.
Look into how the SWS DCF model arrives at its fair value.
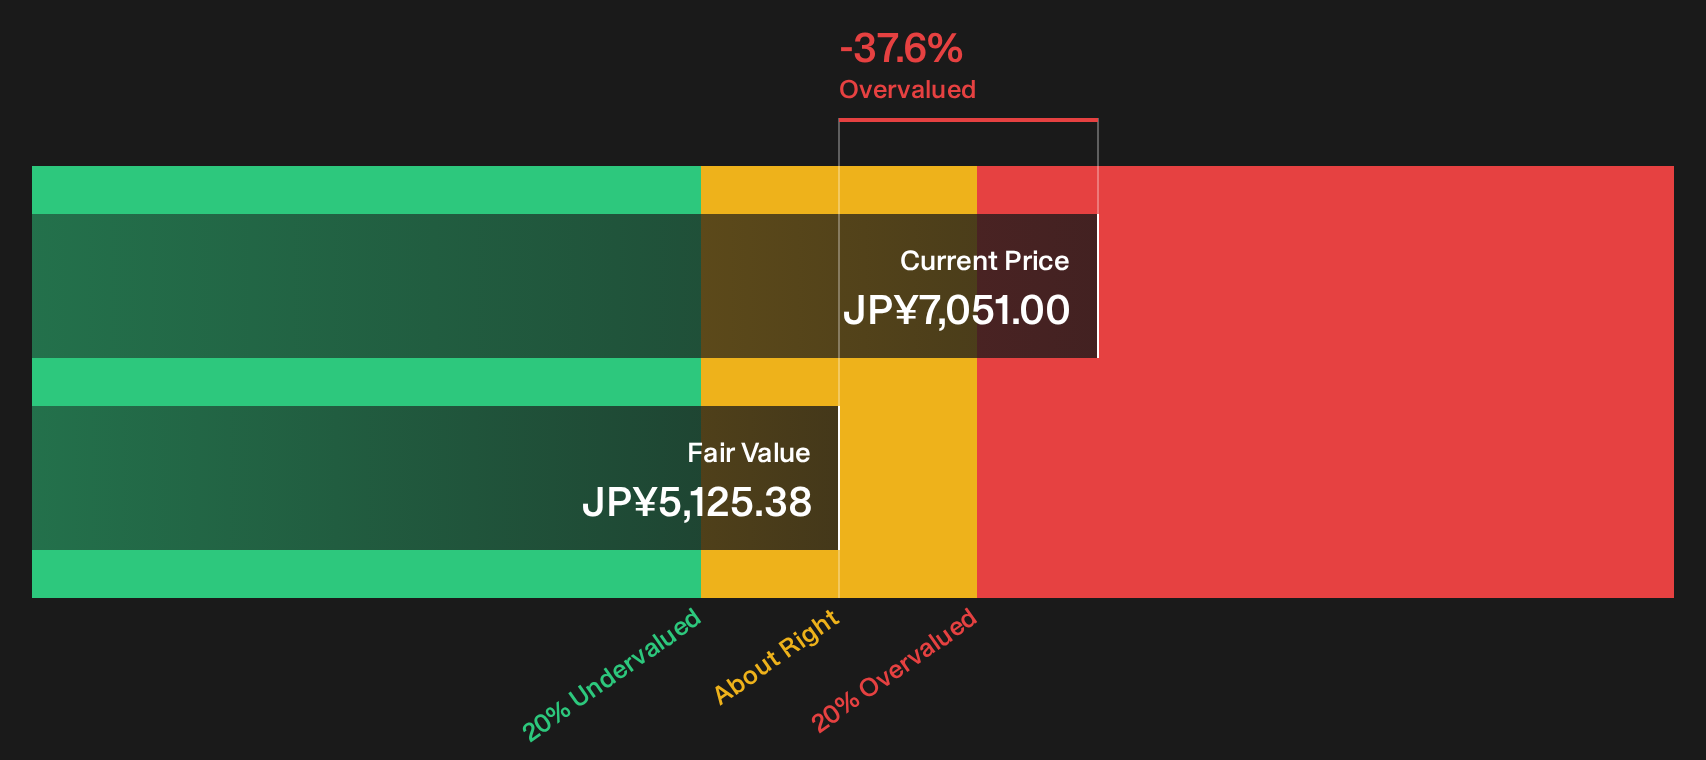
Simply Wall St performs a discounted cash flow (DCF) on every stock in the world every day (check out ULVAC for example). We show the entire calculation in full. You can track the result in your watchlist or portfolio and be alerted when this changes, or use our stock screener to discover 20 high quality undervalued stocks. If you save a screener we even alert you when new companies match - so you never miss a potential opportunity.
Next Steps
If the current mix of cautious and optimistic signals around ULVAC feels difficult to balance, consider reviewing the evidence directly. The business presents both risks that concern investors and potential rewards that many are focusing on, so it is worth examining the 4 key rewards and 3 important warning signs
Looking for more investment ideas beyond ULVAC?
Do not stop your research with ULVAC. Broader context across different types of opportunities can sharpen judgment and highlight risks that do not show up in a single ticker.
- Target potential bargains by scanning a 20 high quality undervalued stocks that highlights companies combining quality fundamentals with prices that may sit below their underlying business strength.
- Prioritise resilience first and sort through a 19 resilient stocks with low risk scores that focuses on businesses with more stable profiles and fewer red flags on key risk metrics.
- Hunt for future leaders early by reviewing a 73 high quality undiscovered gems that surfaces lesser known companies with strong underlying numbers before they attract wider attention.
Have feedback on this article? Concerned about the content? Get in touch with us directly. Alternatively, email editorial-team@simplywallst.com