
Can the rebound in AI stocks reverse the decline in US stocks? The risk of the S&P 500 adjustment has not been lifted, and the 200-day EMA is the key support
The Zhitong Finance App learned that the S&P 500 index never seemed to be able to maintain its high position. Since hitting an all-time high in October, every pullback has hit a lower low, and every rebound has also been lower than the previous high. As inflationary pressure in the US resurfaces, the outlook for the Federal Reserve's monetary policy becomes uncertain, and investors begin to re-examine the huge capital expenditure and return on investment in the field of artificial intelligence (AI), the pressure on US stocks is extending from tech stock valuation adjustments to broader market risks. Technical analysis shows that the US benchmark stock index is currently approaching a key support area. If an important technical level falls, further downward space may open up in the future.
However, US stocks showed a clear rebound before the market on Wednesday, and technology stocks became the main driving force. AI cloud service provider Coreweave announced better-than-expected third-quarter results and raised its full-year revenue forecast. It is expected to achieve adjusted profits in the first half of 2028. Its stock price surged more than 16% before the market, easing market concerns about AI infrastructure investment returns and financing risks. Meanwhile, Nvidia rebounded by about 5% before the market, while chip stocks such as Micron and Mywell Technology rose at the same time. Furthermore, the news that Anthropic plans to go public and has a maximum valuation of 1.4 trillion US dollars has also given a certain boost to the AI sector. However, this round of rebound has yet to eliminate macroeconomic pressure brought about by inflation exceeding expectations and rising expectations of the Federal Reserve's interest rate hike.
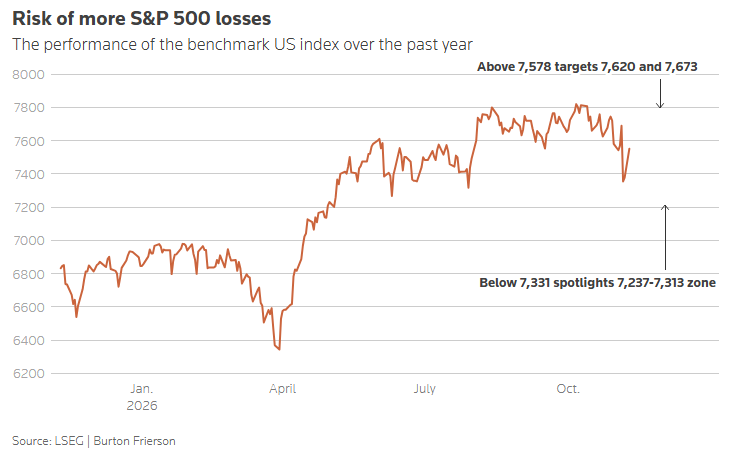
The S&P 500 is approaching the 200-day EMA, falling below 7331 points or facing a deeper adjustment
Technical analysts determine the next possible direction of the market by studying past price trends. When a stock or index is in a downward trend like the S&P 500 index, chart analysts look for so-called support levels, that is, levels that can provide bottom support for the price. Instead, in a rising market, they will look for resistance levels. The resistance level is the opposite of the support level and acts as a “ceiling” for the price.
Support and resistance levels can come in many forms. A moving average is a common reference point. It smooths out price movements by excluding price extremes over a specific period of time. Since moving averages are continuously updated, they also fluctuate up and down as the market changes.
Support and resistance levels can also be determined based on previous highs and lows, as well as so-called Fibonacci retracement levels. Fibonacci retracement levels are a series of price levels calculated based on percentages, and the market tends to return to near these levels after a round of fluctuations. Trend lines — slashes connecting key highs or lows — can also work. Furthermore, important integer levels may also be support or resistance levels; such positions are commonly referred to as psychological barriers.
The fall in the S&P 500 index last week brought it close to the 200-day moving average, an important technical indicator that many markets are closely watching. For the S&P 500, this level is even more significant because the index has never closed below the 200-day moving average since April 8. Furthermore, since the moving average still includes gains from the S&P 500 index's rebound from a low earlier this year, it is still trending upward.
The worrying signs shown in the chart also include that since the October high, the S&P 500 index has continued to show a downward trend in highs and lows. If the S&P 500 falls below the 200-day moving average currently at 7331 points, then the focus of the market will shift to a support area roughly between 7,237 and 7,313 points. This region brings together the June and July lows, a trend line that began in April 2025, and the 38.2% Fibonacci retracement level in the March to October 2026 upward round.
If 7237 points fall, the downward pressure may increase further, and the next important support area will be between 7080 and 6,900 points. This region includes the 50% and 61.8% Fibonacci retracement levels from March to October 2026, a high of 7002.29 points in January, and the psychological barrier of 7,000 points.
However, if the S&P 500 index can rebound and break through Monday's high of close to 7,578 points, the next resistance will come from the 100-day and 50-day moving averages, which are at around 7620 points and 7,673 points, respectively. If the index further breaks through the 7715.57 point high set on November 4, it will break the trend where the high point has continued to move downward since the October high and cause the market to once again shift its focus to the index's record high of 7844.62 points in intraday history.
Inflationary pressure is heating up again, increasing uncertainty about the Fed's policy outlook
The recent US inflation data was higher than market expectations, further increasing the macroeconomic pressure on US stocks. According to data released by the US Department of Labor on November 10, the consumer price index (CPI) rose 0.4% month-on-month in October, higher than the 0.3% expected by economists; excluding food and energy prices, the core CPI rose 0.3% month-on-month, which was also higher than the 0.2% expected by the market.
The inflation data exceeded expectations, causing the market to re-evaluate the Federal Reserve's interest rate path. Affected by this, the market's expectations for the Federal Reserve's interest rate hike in December have clearly heated up. Interest rate futures once reflected a 100% probability of interest rate hikes next month. Most of these bets point to an interest rate hike of 25 basis points, and also include a certain possibility of raising interest rates by 50 basis points. US Treasury yields then rose. In particular, two-year US Treasury yields, which are more sensitive to the Federal Reserve's policy expectations, rose sharply.
This means that investors' previous expectations that monetary policy might shift to easing are being challenged. If inflation continues to rise above the Federal Reserve's 2% target level, policymakers may need to maintain higher interest rates or even further tighten monetary policy. For technology stocks with high valuations, rising interest rates will not only increase corporate financing costs, but also increase the discount rate of future cash flow, thereby putting pressure on stock valuations. If inflation and interest rate expectations continue to deteriorate, it may be difficult for the stock market to gain momentum to continue to rise even if corporate profit performance is good.
AI trading cools down, tech stock sell-off intensifies downward pressure on the index
At the same time, the recent sell-off in the US technology sector also reflects the changing attitude of investors towards the AI investment boom. Over the past few years, the market's optimistic expectations for AI computing power demand, chip sales, and data center construction have driven the stock prices of large technology stocks and semiconductor companies to rise sharply. But as hyperscale cloud service providers continue to increase capital expenses, investors are beginning to pay more attention to whether these huge investments can be converted into sufficient commercial revenue, profits, and free cash flow.
Technology and AI-related stocks have continued to weaken since October. On November 5, semiconductor stocks experienced a sharp sell-off. The Philadelphia Semiconductor Index fell about 11% intraday, and the Nasdaq Composite Index once fell 5% intraday. Companies related to chips, storage, servers, and other AI infrastructure have all been impacted. The market is concerned that the scale of capital required for data center construction continues to expand, and there is still uncertainty about whether the commercialization progress and return on investment of AI applications can keep up with the increase in capital expenditure.
This concern not only concerns chip companies, but is also beginning to affect large cloud service providers. As investment in data center construction and AI infrastructure increases, related companies need to bear higher capital expenses, depreciation and financing costs. If the cash flow generated by the AI business cannot cover these expenses in a timely manner, the free cash flow of the enterprise may be squeezed, which in turn affects the market's judgment on its profitability and valuation.
Goldman Sachs's previous research also pointed out that AI investment has become an important factor driving the profit growth of S&P 500 companies. Its research estimates that nearly half of the 2026 earnings per share increase in the S&P 500 index came from contributions from AI investments. At the same time, the capital expenses of large hyperscale cloud service providers are still huge, and depreciation expenses for related equipment will continue to rise as investment increases. In the future, if the growth rate of capital expenditure slows down and depreciation costs continue to rise, the driving effect of AI investment on corporate profit growth may gradually weaken.
Technology stocks have a high weight in the S&P 500 index, which has also caused the cooling of AI transactions to have a more obvious impact on the overall market. The tech sector still weighs more than 35% in the S&P 500 index. This means that even if the performance of other industries is relatively stable, the continued weakening of technology stocks may significantly drag down the S&P 500 index. More importantly, the AI investment boom also involves large-scale cloud service providers classified as other industries, so the impact of the cooling of AI transactions is not limited to the traditional technology sector.
However, the market's views on AI trading are not entirely pessimistic. Some Wall Street agencies believe that the recent sell-off in technology stocks may have excessively reflected concerns such as stricter data center regulations, the slowdown in AI capital expenditure, and financing risks. Institutions such as Morgan Stanley and UBS believe that related policy risks will not necessarily lead to a complete standstill in AI infrastructure construction; even if some projects are delayed, they may simply delay construction from 2028 to 2029. At the same time, Nvidia's upcoming earnings report and the progress of AI companies' IPOs may also be an important catalyst for the market to re-evaluate AI investment prospects.
Therefore, the key to the current adjustment of technology stocks is not only whether AI investment is slowing down, but investors are re-evaluating the growth pace of the AI industry chain, the capital return cycle, and the valuation level of related companies. If the market gradually confirms that demand for AI is still strong, the recent sell-off may be more of a valuation adjustment; however, if the growth rate of corporate capital expenditure slows significantly and profit expectations begin to decline at the same time, technology stocks may face more prolonged pressure.
However, according to data provided by the London Stock Exchange Group (LSEG), despite a sharp sell-off in technology stocks last week, the decline in the S&P 500 index has not been particularly sharp since the beginning of October. Currently, the index is only down about 4% from its all-time high. This also shows that although market sentiment has clearly weakened, the overall index has not experienced a deep retracement of the same magnitude as that of some technology stocks. The next thing we need to pay attention to is whether the adjustments in technology stocks will spread further to other sectors such as finance, industry, and consumption, and whether the market will shift from concentrating on selling large technology stocks to reducing positions on a wider range of risky assets.
Overall, the S&P 500 is facing a double test of technical and fundamental factors. On the one hand, higher than expected inflation makes the Fed's policy outlook more complicated, and rising US bond yields may also suppress stock valuations; on the other hand, the cooling AI investment boom has prompted investors to re-examine the capital expenditure, profit growth, and cash flow performance of technology companies. In this context, the 200-day moving average of 7331 points and the support area of 7,237 points to 7,313 points will be an important technical hurdle to determine whether the current round of US stock adjustments will further deepen. If these positions can be maintained, the market still has a chance to absorb previous valuation pressure through shocks; however, if key supports fall one after another and profit expectations begin to decline at the same time, US stocks may face the risk of a larger pullback.