
Where Does Berkshire Hathaway (BRK.B) Valuation Sit As Q3 2026 Earnings Mixed?
Berkshire Hathaway (BRK.B) moved back into focus after reporting third quarter 2026 results. Operating earnings were down 5.8% year over year, while revenue rose 11.2% and surpassed consensus estimates.
Berkshire Hathaway shares have picked up momentum, with a 13.13% 1 month share price return and a 17.41% year to date share price gain. The 5 year total shareholder return of 105.87% underlines how the market has rewarded the broader conglomerate model over time despite quarterly earnings swings.
Scan how Berkshire Hathaway's latest swing in earnings and revenue stacks up against other diversified giants with a list of solid balance sheet and fundamentals (24 results) in similar sectors.
Berkshire Hathaway now trades higher after a strong run, yet its mix of declining operating earnings, rising revenue and an intrinsic value estimate implying an 18.6% discount pulls investors toward one key issue: Is most of the upside already in the rear-view mirror or still ahead from here?
Price-to-Earnings of 16.1x: Is it justified?
Berkshire Hathaway now trades on a P/E of 16.1x, which leaves the stock looking modestly cheaper than some peers even after the recent share price run.
The P/E ratio compares what investors pay per share to the earnings that Berkshire Hathaway generates per share. For a sprawling conglomerate that spans insurance, rail, utilities and manufacturing, this yardstick helps you gauge how much the market is willing to pay for its profit engine.
Here the picture is mixed. The current P/E of 16.1x sits meaningfully below the peer average of 23.9x, which indicates that the market is pricing Berkshire Hathaway at a lower earnings multiple than many diversified financial groups. At the same time, the multiple is higher than the broader US Diversified Financial industry average of 14.7x. This gap suggests investors are accepting a premium level compared with that industry average, while the fair P/E estimate of 17.5x indicates that there may still be some room for that gap to close.
Explore the SWS fair ratio for Berkshire Hathaway.
Result: Price-to-Earnings of 16.1x (UNDERVALUED)
Still, Berkshire Hathaway faces clear pressure from falling net income growth and the risk that any reversal in recent share price momentum could quickly narrow that valuation gap.
Find out about the key risks to this Berkshire Hathaway narrative.
Another View on Berkshire Hathaway's Value
That 16.1x P/E paints Berkshire Hathaway as slightly cheap on earnings, yet the SWS DCF model points to a future cash flow value of $716.66 per share versus the current $583.34. On that score the stock screens as undervalued. Which signal do you treat as the anchor?
Look into how the SWS DCF model arrives at its fair value.
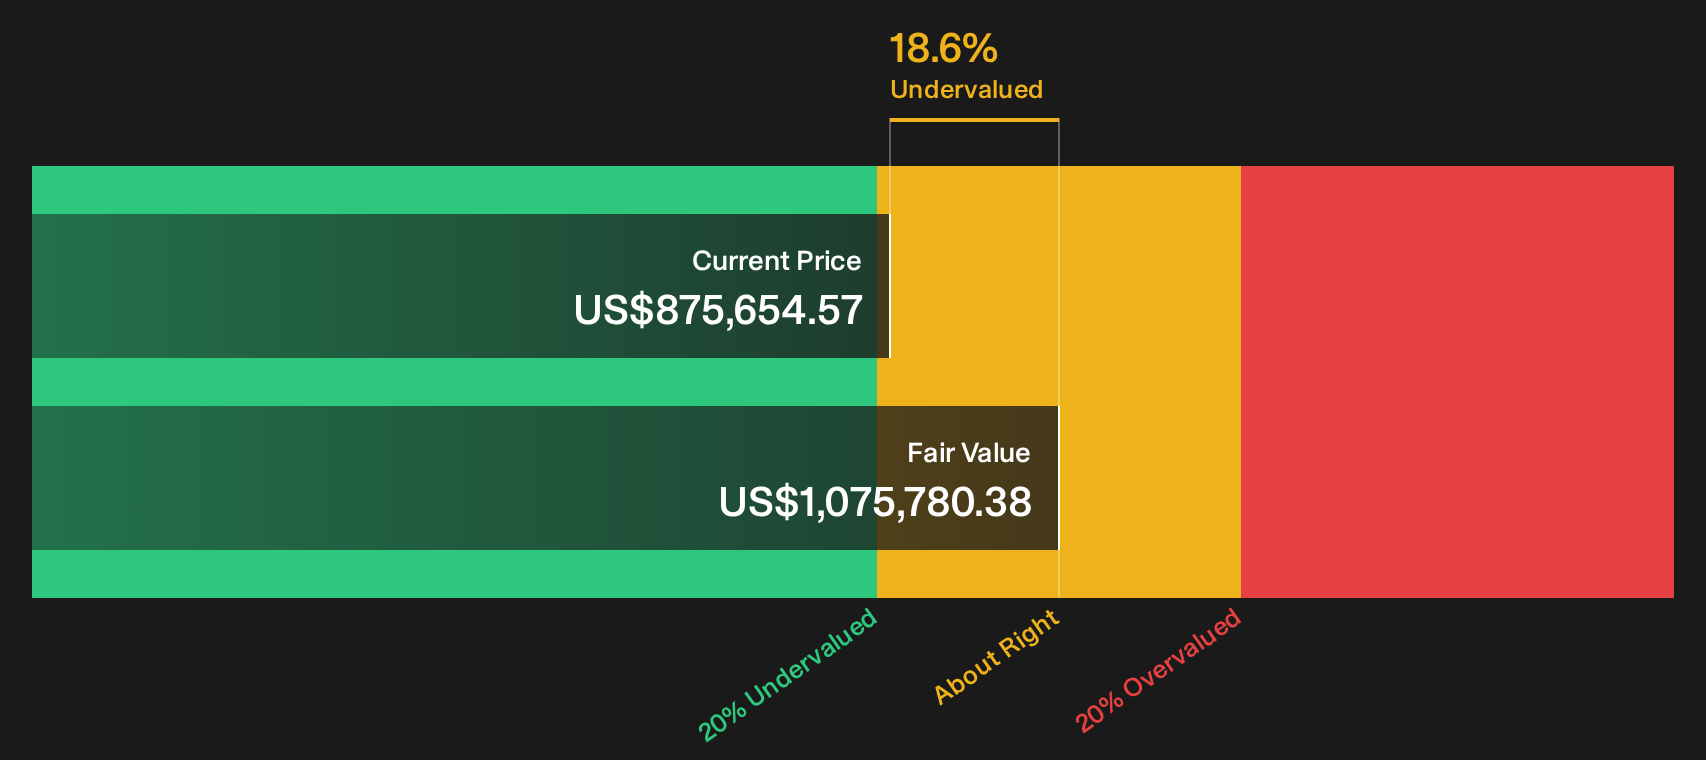
Simply Wall St performs a discounted cash flow (DCF) on every stock in the world every day (check out Berkshire Hathaway for example). We show the entire calculation in full. You can track the result in your watchlist or portfolio and be alerted when this changes, or use our stock screener to discover 35 high quality undervalued stocks. If you save a screener we even alert you when new companies match - so you never miss a potential opportunity.
Next Steps
Mixed signals around Berkshire Hathaway can feel confusing at first glance, so move quickly, review the full dataset carefully, and weigh both sides of the story with the 2 key rewards and 1 important warning sign
Looking for more ideas beyond Berkshire Hathaway?
If Berkshire Hathaway sharpened your interest, do not stop here. The next move in your portfolio could come from opportunities the market has not fully priced yet.
- Target high quality companies that look mispriced today by scanning the 35 high quality undervalued stocks.
- Build a steadier portfolio foundation by checking out the 30 resilient stocks with low risk scores that score well on resilience.
- Hunt for lesser known opportunities with robust fundamentals through the 20 high quality undiscovered gems.
Have feedback on this article? Concerned about the content? Get in touch with us directly. Alternatively, email editorial-team@simplywallst.com