
Synchrony Financial (SYF) Stock Looks Undervalued As Its 150% Run Faces Scrutiny
Synchrony Financial has delivered a powerful share price run over the past few years, yet more recent declines have raised a fresh question about whether the current market value still lines up with what its earnings support. With the stock now trading at US$71.70 after a weaker stretch this year, investors are asking how much of its earnings power is already reflected in that price.
- Over the past 3 years, Synchrony Financial has returned about 150.4%, which puts a lot of weight on whether its earnings can justify that kind of long term rerating.
- The business leans heavily on consumer credit profitability and loss management, so the way its net interest margin and credit costs evolve can reshape what investors are willing to pay for each dollar of earnings.
- Your read on Synchrony Financial is one view; the desks covering it have another. See what analysts think Synchrony Financial's shares could be worth.
The issue now is whether Synchrony Financial's current share price is justified by its earnings when judged against the Fair Ratio benchmark.
If you want to test the same earnings question driving Synchrony Financial's valuation across a broader watchlist, take a look at 35 high quality undervalued stocks.
Is Synchrony Financial a Bargain on Earnings?
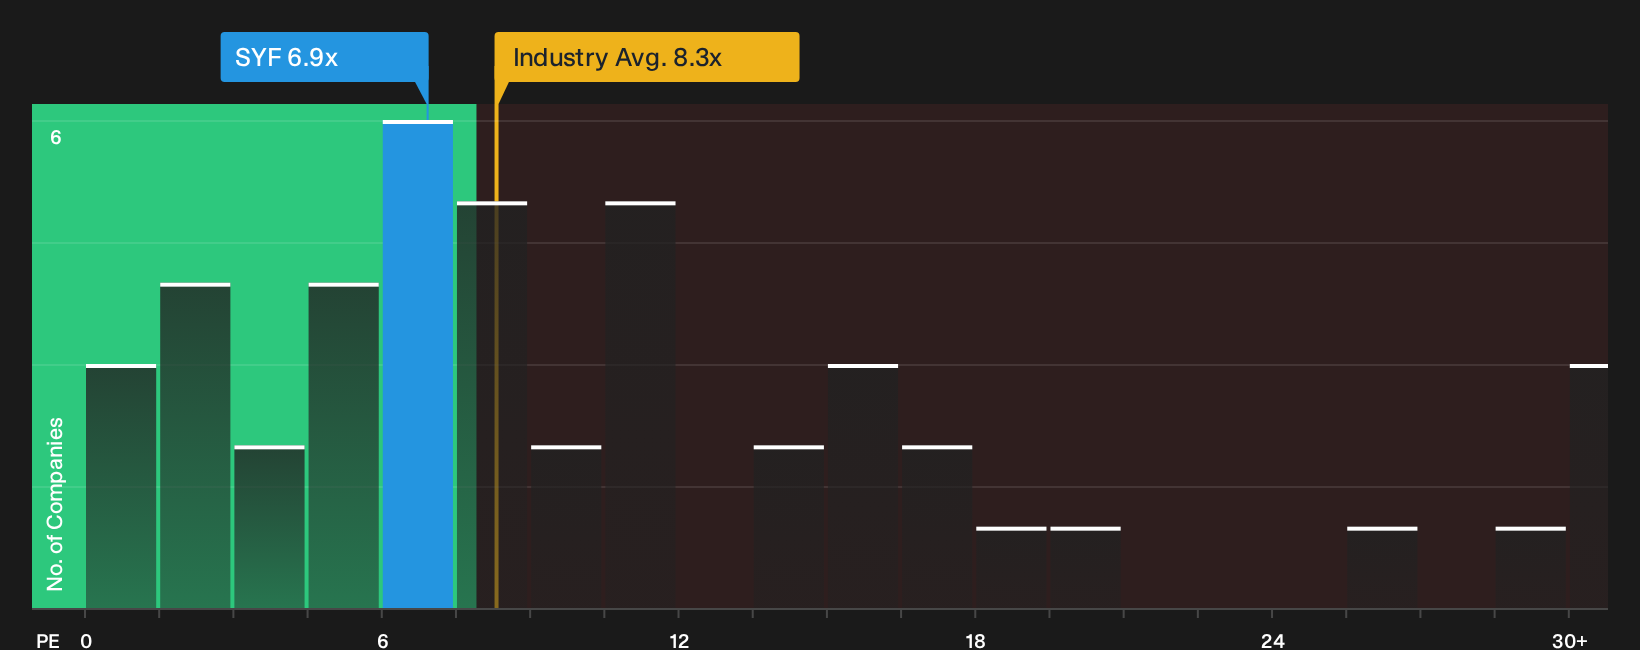
The P/E ratio fits Synchrony Financial because earnings remain the main yardstick investors use to judge a lender’s profit engine. On this measure, the stock trades on a P/E of 6.9x, which sits below the consumer finance industry average of 8.3x and well under the wider peer group at 15.9x. That gap suggests the market is pricing Synchrony at a lower tag per dollar of earnings than many comparable businesses with similar business models.
A Fair Ratio that blends factors such as expected profitability, risk profile and sector norms indicates Synchrony Financial trades below the level that model would point to, so the shares screen as undervalued on this framework. For anyone assessing the current US$71.70 price, the key question is whether Synchrony’s earnings quality and credit cycle exposure justify this discount or point to a market that may be underestimating its profit power. Explore the numbers behind Synchrony Financial's P/E valuation.
The Synchrony Financial Narrative: What Would Justify Today's Price?
Simply Wall St Narratives for Synchrony Financial pick up where this valuation puzzle leaves off. They outline which potential paths for Synchrony Financial's future earnings, margins and growth would need to align for the stock to be worth meaningfully more or less than it is today. Each narrative bases its figures on a clear view of how growth, profitability and risk could develop, giving you something specific to track as new information becomes available.
One of the top community narratives on Synchrony Financial: 32% undervalued
According to barmoss, an investor in the Simply Wall St Community who wrote the Narrative, Synchrony Financial could be pricing in more risk than its fundamentals imply.
"Your DCF/Excess Return analysis suggests Synchrony Financial’s intrinsic value is around $145 per share, meaning the stock could be trading at a steep discount..."
Discover why this Narrative puts Synchrony Financial at 32% undervalued.
One more Synchrony Financial check that belongs beside the earnings multiples
Price and profit metrics only tell part of the story, because internal risk checks on Synchrony Financial have highlighted specific concerns that deserve a closer look before you lean on any valuation work. Take a closer look at 2 warning signs (1 major) before settling on a valuation.
Have feedback on this article? Concerned about the content? Get in touch with us directly. Alternatively, email editorial-team@simplywallst.com