
Trinity Industries (TRN) Reports Mixed Third Quarter Earnings, Is It Still Undervalued?
How Trinity Industries' latest earnings reset the conversation
Trinity Industries (TRN) just posted third quarter results that mixed softer profit with higher revenue, giving investors a fresh data point to reassess the railcar specialist’s recent share price performance.
Recent trading reflects that mixed picture. The share price has delivered a 16.97% 1 month share price return and a 10.76% year to date share price return. The 1 year total shareholder return of 20.32% and 3 year total shareholder return of 44.42% suggest longer term holders have already seen a meaningful payoff as sentiment around Trinity Industries oscillates with each earnings update.
See how Trinity Industries' rail earnings compare with other industrial companies reporting fresh results, using a hand picked set of list of solid balance sheet and fundamentals (25 results)
Trinity Industries now trades close to a single digit discount to consensus targets after a strong short term run, while quarterly earnings softened. Is that pricing gap a genuine opportunity or sensible caution about profit quality and momentum?
Most Popular Narrative: 4% Undervalued
Trinity Industries last closed at $29.85 against a narrative fair value of $31, and the analyst consensus Narrative on Simply Wall St ties that mild discount to how effectively the business converts its railcar assets into earnings using a leasing heavy model and portfolio gains.
Ongoing portfolio management actions such as railcar sales and partnership restructurings, including large non cash gains from recent transactions and management’s estimate that the owned fleet is worth 35% to 45% above carrying value, give Trinity Industries multiple ways to convert embedded asset value into gains, cash flow, and potentially higher earnings.
See why 3 investors see Trinity Industries as 4% undervalued.
Result: Fair Value of $31 (UNDERVALUED)
Still, Trinity Industries carries real pressure points, including its reliance on cyclical sectors such as energy and agriculture, as well as ongoing dependence on portfolio gains to support earnings.
Find out about the key risks to this Trinity Industries narrative.
Another View: Cash Flows Paint a Tougher Picture for Trinity Industries
The first narrative around Trinity Industries leans on asset value and an earnings-based fair value of $31, which screens as mildly undervalued versus the $29.85 share price. A different lens using the SWS DCF model tells a cooler story, with an estimated future cash flow value of $23.61, implying the stock trades above that level and screens as expensive on this measure.
Both views rest on real numbers, not guesswork, yet they pull in opposite directions. For an investor weighing fresh earnings against railcar asset value, the key question is which lens to trust when cash generation and one off gains point in different directions.
Look into how the SWS DCF model arrives at its fair value.
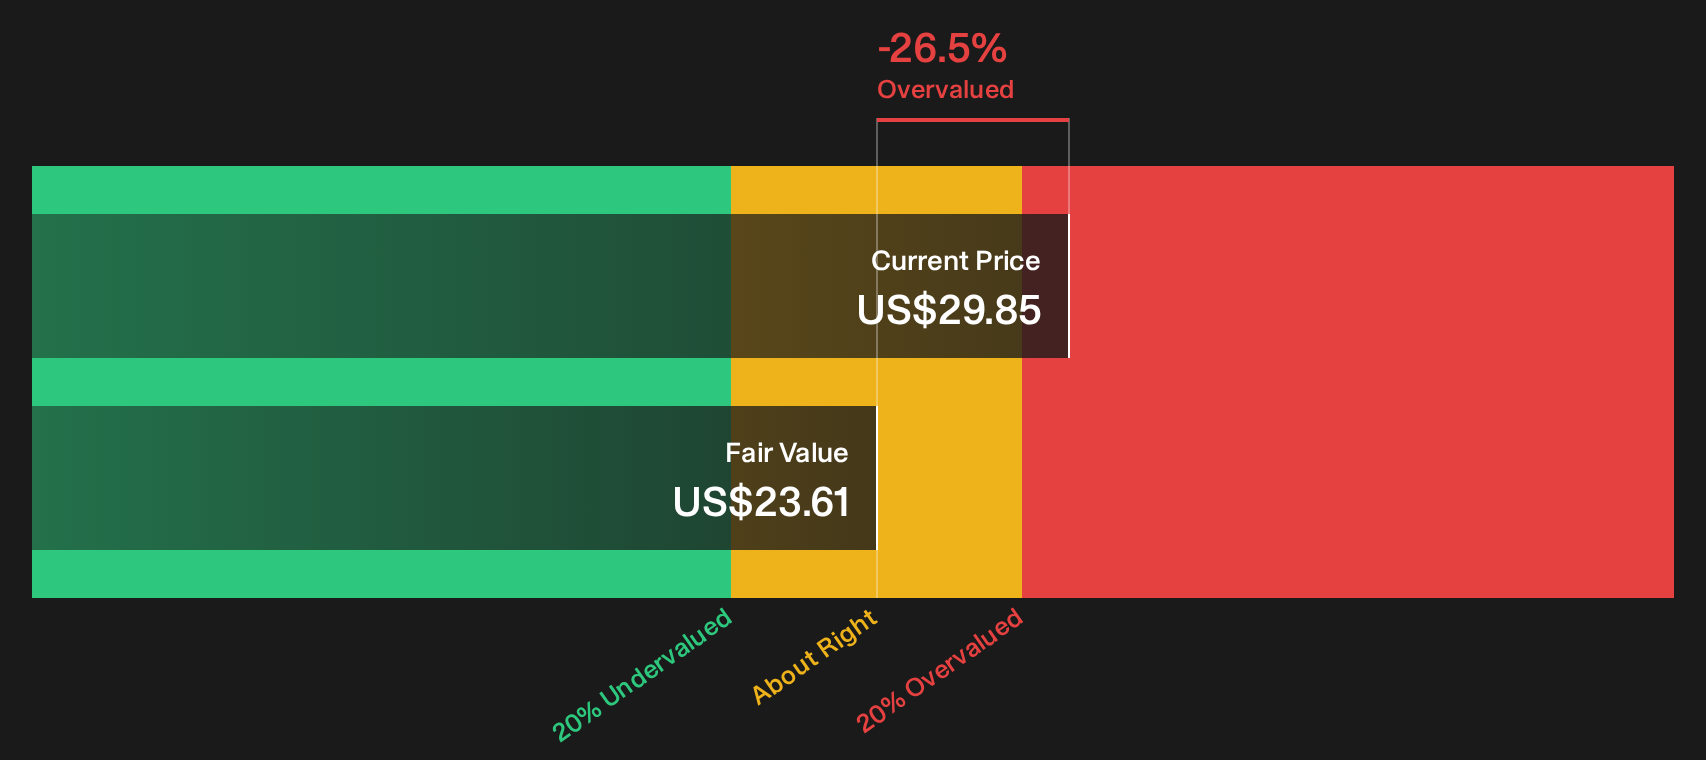
Simply Wall St performs a discounted cash flow (DCF) on every stock in the world every day (check out Trinity Industries for example). We show the entire calculation in full. You can track the result in your watchlist or portfolio and be alerted when this changes, or use our stock screener to discover 33 high quality undervalued stocks. If you save a screener we even alert you when new companies match - so you never miss a potential opportunity.
Next Steps
If the split between risks and rewards around Trinity Industries feels finely balanced, treat that as a prompt to move quickly and review the underlying data yourself. Start by weighing how the 2 key rewards and 5 important warning signs aligns with your own expectations for the business.
Looking for more investment ideas beyond Trinity Industries?
If Trinity Industries has sharpened your focus on risk, return, and price, do not stop here. Broaden your watchlist now so you are not reacting late.
- Target quality at a discount by scanning a 33 high quality undervalued stocks that combines stronger fundamentals with prices that still look reasonable against recent financials.
- Build a sturdier income stream by reviewing a curated set of 6 dividend fortresses that pair higher yields with balance sheets that aim to support ongoing payouts.
- Reduce unpleasant surprises by focusing on a 30 resilient stocks with low risk scores built around more resilient financial profiles and lower overall risk scores.
Have feedback on this article? Concerned about the content? Get in touch with us directly. Alternatively, email editorial-team@simplywallst.com