Passenger Transport Association Branch: In October, the domestic car market's “peak season was not strong”, retail sales in the passenger car market fell 27.1% year on year
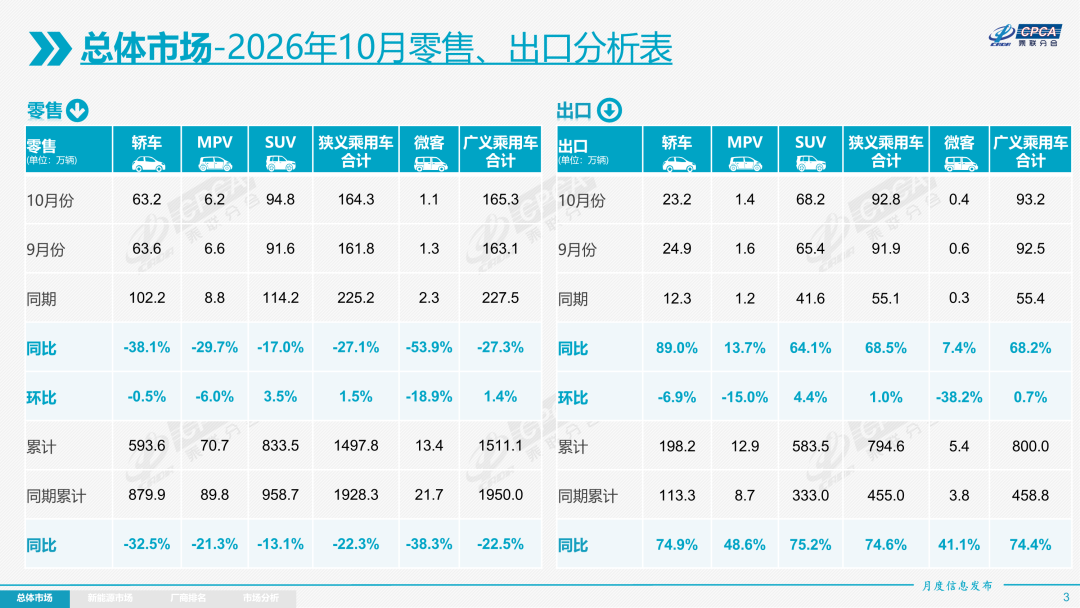
The Zhitong Finance App learned that on November 9, the Passenger Transport Association published an analysis of the national passenger car market for October 2026. In October 2026, the national passenger car market retailed 1.643 million vehicles, down 27.1% year on year and up 1.5% month on month; in January-October, the total retail sales of passenger cars was 14.978 million units, down 22.3% year on year. The most prominent characteristic of the domestic car market in October was that the “peak season was not strong”, and the traditional “Silver Ten” was seriously underdeveloped. Since the Mid-Autumn Festival falls in September, the sales period in October was long, and the performance was better than in September. The purchasing performance of first-time buyers, which supported the growth of the autumn/winter car market this year, was poor. The downturn in the A00 and A class markets indicates that recent policies in the car market have mainly supported consumption upgrades, and the increase in the subsidy threshold has limited the demand for car buyers from those without cars.
1. Review of the national passenger car market in October 2026
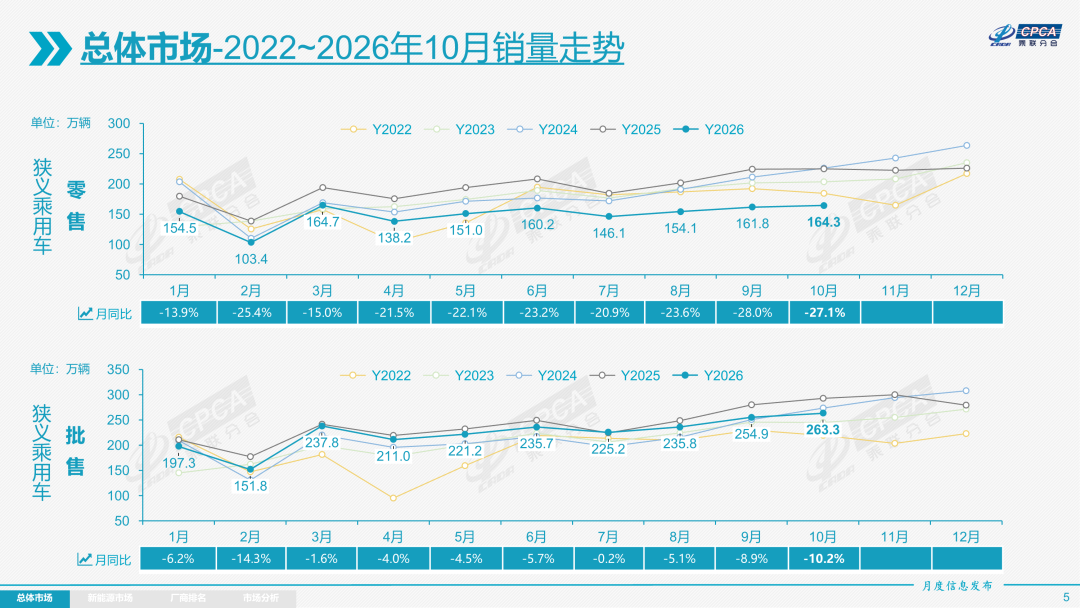
Retail sales: In October 2026, the national passenger car market retailed 1.643 million units, down 27.1% year on year and up 1.5% month on month; from January to October, passenger cars sold a total of 14.978 million units, a decrease of 22.3% year on year.
Against the backdrop of heavy pressure on the car market and the year-on-year decline in retail sales in October 2026, strong export performance became a key variable supporting the sales volume of car companies, and the export structure showed obvious characteristics of “medium- to low-priced mainstream models”, which directly contributed to mainstream independent brands showing more prominent performance in performance differentiation. Specifically, passenger car exports (including complete vehicles and CKD) reached 928,000 units in October, an increase of 68.5% over the previous year, and exports accounted for 35% of the manufacturer's sales volume (19% last year). Among them, 582,000 new energy passenger vehicles were exported, a year-on-year increase of 144.7%. A00+A0 class pure electric vehicles accounted for 56% of pure electric exports. Since export models are mainly mainstream models at medium to low prices, independent brands (such as BYD, Chery, and Geely), which focus on cost performance and scale advantages, are more resilient in sales, driven by exports, while car companies that rely on high-end or pure fuel models are under greater pressure. This confirms the core logic of the current car market: under the pattern of “domestic stock game, overseas incremental breakthroughs,” the structural dividends of exports are reshaping the competitive position of independent brands.
The most prominent characteristic of the domestic car market in October was that the “peak season was not strong”, and the traditional “Silver Ten” was seriously underdeveloped. Since the Mid-Autumn Festival falls in September, the sales period in October was long, and the performance was better than in September. Revenue dropped after the fall harvest and the weather became colder, so demand for cars should be highlighted, but the purchasing performance of first-time buyers supporting the growth of the autumn/winter car market this year is poor. The slump in the A00 and A class markets indicates that the recent policies in the car market have mainly supported consumption upgrades, and the increase in the subsidy threshold has somewhat suppressed the car purchase demand of people without cars. The fuel vehicle market has been lacking in new products for a long time, and usage costs are rising, which is not conducive to the full release of the purchasing power of first-time buyers.
Recently, oil prices have been high. Prices on the non-ferrous and mining side have risen, and consumers' purchasing power and willingness to buy are low.
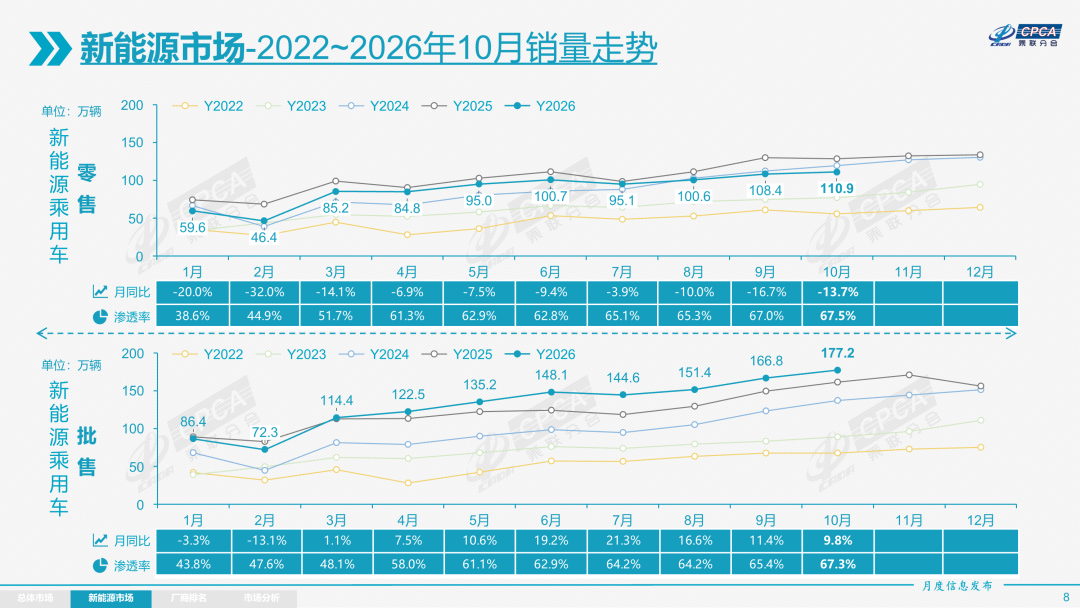
Taken together, the passenger car market showed five distinct characteristics in October: 1. The total volume continued to be under deep year-on-year pressure, and structural differentiation was maximized. “Accelerated fuel shrinkage and new energy resilience leadership” became the main line of the market, and high fuel prices continued to accelerate the pace of “oil and electricity substitution”; 2. The penetration rate of new energy sources was supposed to level off seasonally in autumn, but new energy continued to break through new highs this year. The retail penetration rate rose to 67.5% in October, and the wholesale penetration rate reached 67.3%, all of which reached record highs; 3. Dramatic changes, strong growth between Xiaomi and Leader drove growth in October Strong month-on-month; in April and October, fuel vehicle exports accounted for 40% of manufacturers' wholesale fuel vehicle sales (24% in October '25), and NEV exports accounted for 33% of manufacturers' new energy wholesale sales (15% in October '25). “Exports surpassed domestic demand” to stabilize car companies' wholesale and profits. This month, exports of luxury new energy vehicles accounted for 78% of manufacturer sales, and export sales became the core driving force for the growth of car companies; 5. SAIC-GM and FAW-Volkswagen's new pure electric products surged strongly. SAIC-GM hybrid sales became the main force in hybrid sales. Stronger. However, the current downturn in the car market is a phased phenomenon where short-term policy disturbances and a high base figure are superimposed. The fundamentals of automobile popularity are not at its peak. The characteristics of “high popularity in big cities and weak popularity in counties and villages” are particularly obvious. The blue ocean of demand for first-time purchases in sinking counties is still broad.
In October, retail sales of fuel vehicles fell 45% year on year. Among them, pure fuel vehicles fell 51% year on year, and ordinary hybrid vehicles increased 28% year on year. Among fuel vehicles, autonomy fell 46% year on year, mainstream joint ventures fell 46% year on year, and luxury fell 37% year on year, all of which were severely impacted by high fuel prices without discrimination.
In October, retail sales of new energy vehicles fell 13.7% year on year, with autonomous vehicles falling 15%, mainstream joint ventures growing 69%, luxury falling 45%, and domestic retail sales of autonomous A00 class electric vehicles being affected by unfavorable subsidy policies.
In October, retail sales of 1.21 million vehicles under independent brands were recorded, a year-on-year decrease of 22% and a year-on-month increase of 7%. The domestic retail share of independent brands in the same month was 73.8%, an increase of 4.8 percentage points over the previous year. Overall, the performance of independent brands in the new energy market and export market is relatively stable.
Mainstream joint venture brands retailed 320,000 vehicles in October, down 38% year on year and up 2% month on month.
In October, the retail share of German brands was 12.6%, down 1.1 percentage points from the previous year, and the retail share of Japanese brands was 10.2%, down 2.1 percentage points from the previous year. The retail share of American brands in the market was 2.7%, down 1.1 percentage points from the previous year.
In October, 110,000 luxury cars were sold, down 39% year on year and 34% month on month. The retail share of luxury brands was 7% in October, down 1.4 percentage points year on year.
Exports: According to Passenger Link data, passenger car exports (including complete vehicles and CKD) were 928,000 units in October, up 68.5% year on year and 1.0% month on month, accounting for 35% of passenger car manufacturers' sales volume (36% in the previous month, 19% in the same period in 2025). New energy vehicles accounted for 62.8% of total exports in October, an increase of 20 percentage points over the same period. In October, exports of independent brands reached 810,000 vehicles, up 77% year on year; joint ventures and luxury brands exported 118,000 vehicles, up 28% year on year.
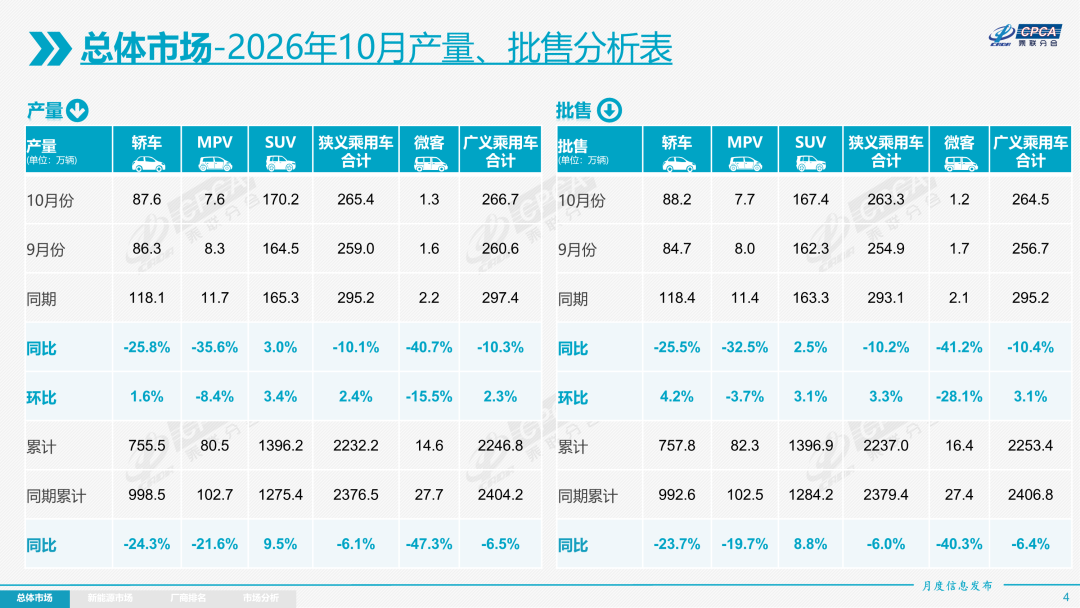
Production: In October, 2.654 million passenger cars were produced, down 10.1% year on year and up 2.4% month on month. In October, luxury brand production fell 26% year on year and 12% month on month; joint venture brand production fell 37% year on year, down 15% month on month; independent brand production fell 2% year on year, up 7% month on month.
Wholesale: In October, passenger car manufacturers across the country sold 2.633 million vehicles, down 10.2% year on year and up 3.3% month on month. Encouraged by the surge in exports, the year-on-year growth rate of passenger car wholesale in October was 16.9 percentage points higher than retail sales growth. In October, autonomous car companies wholesale 2,090,000 vehicles, a year-on-year decrease of 2% and a year-on-month increase of 6%. Mainstream joint ventures wholesale 368,000 vehicles, a year-on-year decrease of 36% and a year-on-month increase of 2%. 174,000 luxury cars were sold, down 25% year on year and 22% month on month.
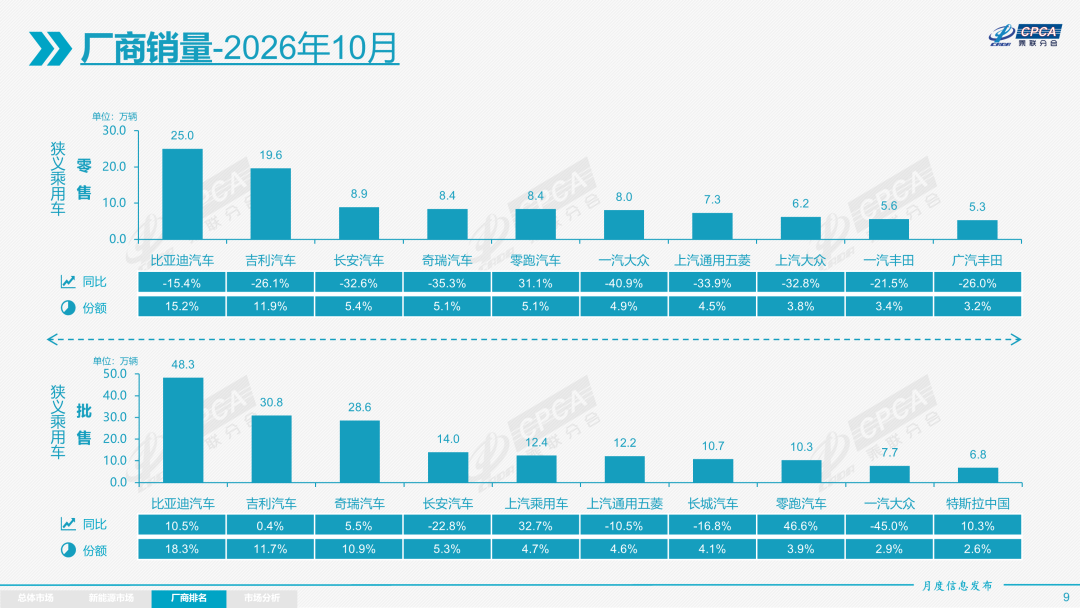
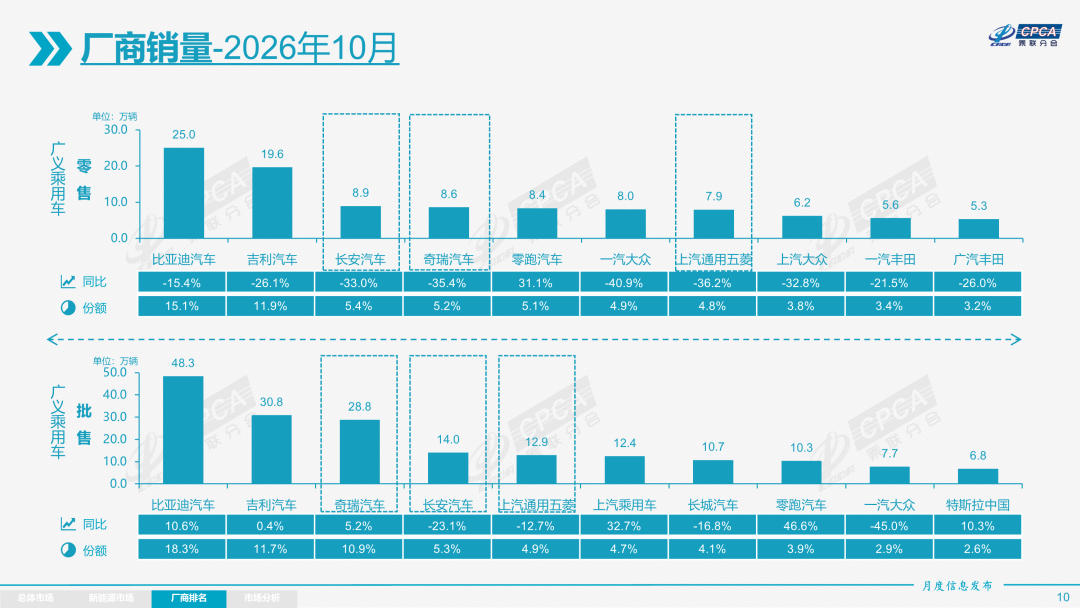
In October, the overall wholesale pattern of major passenger car manufacturers continued to change, and car companies such as Zero Sports Auto, GAC Aian, BAIC Motor, and SAIC Motor achieved high growth of more than 20% over the same period last year. The concentration of the car market was relatively stable in October, with 8 passenger car manufacturers with wholesale sales of over 100,000 vehicles (6 in the previous month and 7 in the same period last year), accounting for 63.5% of the overall market share (54% last month and 55% in the same period). Passenger car manufacturers with a wholesale volume of 5-10 million vehicles accounted for 16.1% (21% in the previous month, 22% in the same period), and passenger car manufacturers with a wholesale volume of 10,000 to 50,000 vehicles accounted for 16.8% (22% last month, 22% in the same period).
Inventory: Due to high market operating pressure in October, manufacturers' wholesale sales fell below 21,000 units in October, while the monthly domestic wholesale volume of manufacturers was higher than domestic retail sales of 63,000 units. The characteristics of inventory removal are prominent this year. The overall inventory of the passenger car industry fell by 600,000 units from January to October (100,000 units in the same period in 2025, 940,000 units in the same period in 2024, and 90,000 units in the same period in 2023).
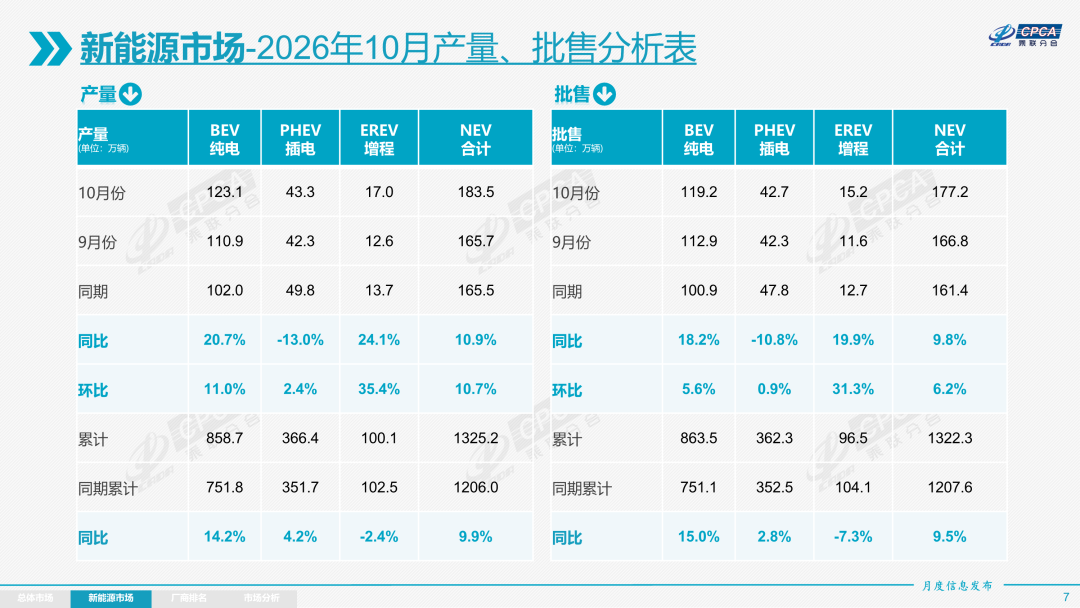
New energy: Production of new energy passenger vehicles reached 1.835 million units in October, up 10.9% year on year and 10.7% month on month. From January to October, the cumulative production of new energy passenger vehicles reached 13.252 million units, an increase of 9.9% over the previous year.
In October, wholesale sales of new energy passenger vehicles reached 1.772 million units, up 9.8% year on year, up 6.2% month on month; from January to October, cumulative wholesale sales of new energy passenger vehicles reached 13.223 million units, up 9.5% year on year. Wholesale sales of conventional fuel passenger cars reached 860,000 units in October, down 35% year on year and 2% month on month.
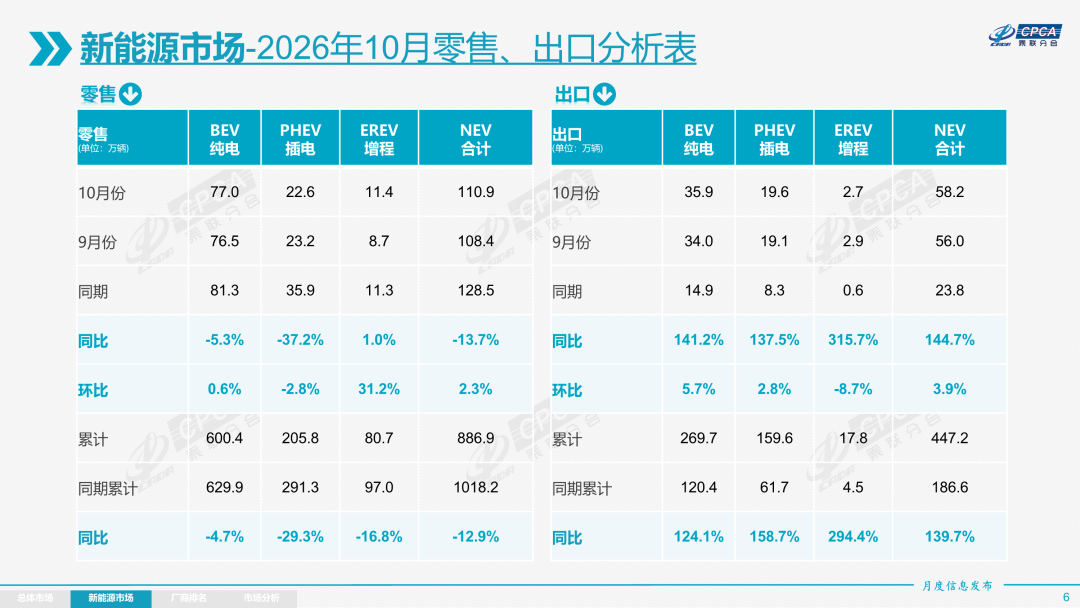
In October, the NEV passenger car market retailed 1.109 million vehicles, down 13.7% year on year and up 2.3% month on month; in January-October, the NEV passenger car market retailed 8.869 million units, down 12.9% year on year. In October, 530,000 conventional fuel passenger cars were sold, down 45% year on year and 0.1% month on month; among them, ordinary hybrid vehicles increased 28% year on year and 1.3% month on month.
In October, NEV manufacturers exported 582,000 vehicles, up 144.7% year on year, up 3.9% month on month; in January-October, NEV manufacturers exported 4.472 million vehicles, up 139.7% year on year. In October, 346,000 conventional fuel passenger cars were exported, up 11% year on year and down 4% month on month.
1) Wholesale: The wholesale penetration rate of NEV manufacturers was 67.3% in October, up 12 percentage points from October 2025. In October, the penetration rate of own-brand new energy vehicles was 77.1%; the penetration rate of new energy vehicles among luxury cars was 48.4%; and the penetration rate of mainstream joint venture brand NEVs rose to 20.7%.
In October, wholesale sales of pure electric vehicles were 1.192 million units, up 18.2% year on year, up 5.6% month on month; in October, the narrow mix sales volume was 427,000 units, down 10.8% year on year, up 0.9% month on month; in October, extended range wholesale sales were 152,000 units, up 19.9% year on year, up 31.3% month on month. In the new energy wholesale structure in October, pure electricity accounted for 67.3% (YoY +4.8%, -0.4% month-on-month), narrow interpolation accounted for 24.1% (-5.5% YoY, -1.3% month-on-month), and extended-range accounted for 8.6% (YoY +0.7%, month-on-month +1.6%).
In October, 307,000 B-class electric vehicles were sold, up 12% year on year, down 7% month on month, accounting for 26% of pure electric share, down 1.4 percentage points from the same period last year. There is a lot of pressure on the A00 class economy electric vehicle market. In October, A00 class wholesale sales volume was 101,000 units, down 41% year on year, up 29% month on month, accounting for 8% of pure electric vehicles, down 8.6 percentage points from the same period last year; A0 grade wholesale sales volume was 456,000 units, accounting for 38% of pure electric vehicles, up 13.6% year on year; A-class electric vehicles accounted for 23% of the pure electric share, down 3.6 percentage points year on year; judging from the long-term popularity trend, the growth of economical electric entry-level electric vehicles is the most promising. Tadashi There is a sustainable growth in the motor vehicle market.
The wholesale sales volume of passenger cars in October was 25 models (23 last month), BYD Song (74,365 units), Geely Xingyuan (71,337 units), BYD Yuan UP (69,216 units), BYD Dolphin (39,096 units), Model Y (38,567 units), MG4 EV (35,876 units), Qiyuan Q05 (35,023 vehicles), BYD Seagull (32,287 units), Hongguang MINI (31,402 units), and 5 vehicles Ling Bingguo (30,954 vehicles), Zero Sport A10 ( 30,687 vehicles), Equation Leopard Titanium 7 (30,274 vehicles), BYD Yuan Plus (30,240 vehicles), Tiggo 7 (30,239 vehicles), Starship 7 (29,501 vehicles), Model 3 (29,262 vehicles), Chery JAECOO J5 (26,689 vehicles), Xingyue L (26,433 vehicles), Boyue (25,075 vehicles), MG ZS (23,574 vehicles), Jetstar (23,3066 vehicles), BYD Seal (23,30606 vehicles), BYD Seals (23,30606 vehicles) (22,467 vehicles), BYD Sea Lion 06 ( 21,957 vehicles), BYD Sea Lion 05 (21,106 vehicles), and Xiaopeng L03 (20,637 vehicles). Among them, new energy models occupy an absolute dominant position.
2) Retail sales: The overall retail penetration rate of new energy vehicles in China in October was 67.5%, an increase of 10.5 percentage points over the same period last year, and an increase of 0.5 percentage points over the same period last year. In domestic retail sales in October, the penetration rate of new energy vehicles among independent brands was 84.8%; the penetration rate of new energy vehicles among luxury cars was 19.4%; while the penetration rate of new energy vehicles in mainstream joint venture brands only rose to 19.7%. Looking at the monthly domestic retail share of new energy vehicles, in October, the retail share of own-brand NEVs was 68.2%, down 2.6 percentage points from the previous year; mainstream joint venture brands had a share of 5.9%, an increase of 2.6 percentage points over the previous year; the share of new forces was 23.9%, and brands such as Zero Sports cars drove the share of new forces to increase 1.2 percentage points year over year.
3) Exports: In October, 582,000 new energy passenger vehicles were exported, up 144.7% year on year and 3.9% month on month. Passenger car exports account for 62.8%, an increase of 20 percentage points over the same period last year; of these, pure electric vehicles account for 61.7% of new energy exports (62.6% in the same period last year), and A00+A0 class pure electric vehicles, which are the core focus, account for 56.4% of pure electric exports (42.1% in the same period last year). As the scale advantage of new energy vehicles in China becomes apparent and market demand expands, new energy brand products made in China are increasingly going abroad, and their recognition overseas continues to increase. Among them, the narrow interpolation accounted for 33.7% of new energy exports (34.7% in the same period last year), and the growth range accounted for 4.6% of new energy exports (2.7% in the same period last year). Despite some recent interference from external countries, the number of autonomous mixed export developing countries in the narrow sense is growing rapidly, and the advantages are obvious. Excellent companies in terms of new energy exports in October were: BYD Auto (165,194), Chery (83,843), Geely (80,119), Tesla China (59,012), SAIC Motor (42,030), Changan (30,343), Zero Sports (21,132), SAIC-GM Wuling (16,866), Xiaopeng (13,326 vehicles), GAC Aian (12,150 vehicles), Great Wall Motor (12,0 vehicles) 29 cars).
Looking at overseas system construction, some independent brands account for a relatively high share of CKD exports, and their international performance is excellent. Among them, Great Wall Motor's CKD exports account for 31.1%, SAIC-GM-Wuling CKD exports account for 41.9%, Zero Sports Car's CKD exports account for 8.0%, and SAIC Motor's CKD exports account for 27.6%.
4) Vehicle companies: The overall trend of new energy passenger car companies was strong in October. BYD's pure electric and plug-in hybrid dual drive consolidated its leading position in new energy brands; plug-in hybrid performance in the narrow sense represented by BYD, Geely, and Chery continued to be strong, and new energy sources such as SAIC passenger cars, SAIC Volkswagen, and SAIC-GM grew strongly. In terms of product launch, with autonomous vehicle companies' implementation of the “multi-line approach” strategy on the new energy route, the market base continues to expand. The number of manufacturers with monthly wholesale sales of new energy exceeding 10,000 vehicles reached 23 (1 less than the previous month and 1 less than the previous month), accounting for 95.5% of the total number of new energy passenger vehicles (94.3% last month and 94.5% in the same period last year). Among them, BYD (482,610), Geely (211,240), Chery (133,890), Zero Sports (103,025), Changan (99,494), SAIC-GM-Wuling (97,241), SAIC Motor (76,479), Tesla China (67,829), Xiaopeng (50,237), Xiaomi (50,168), Great Wall Motor (49,849,8494), Guangzhou Automobile (49,849,498), Guangzhou Automobile AEON (43,160 vehicles), NIO ( 34,246), Ideal (29,025), Dongfeng (28,141), Jihu (24,857), Cyrus (22,136), FAW Pentium (19,643), SAIC Volkswagen (17,975), FAW-Volkswagen (14,933), SAIC-GM (12,344), FAW-Hongqi (11,629), GAC Toyota (11,058).
The corporate brands that have sold more than 20,000 new energy passenger vehicles in China are: BYD (250,301), Geely (131,708), Zero Sports (83,573), Changan (68,925), SAIC-GM-Wuling (67,696), Xiaomi (50,123), Chery (44,747), SAIC Passenger Cars (38,881), Great Wall Motors (37,469 vehicles), Little Motors (36,911 vehicles), Weilai (36,911 vehicles) Automobiles (34,030 vehicles), Hongmeng Zhixing ( 33,538), GAC Aian (30,011), Ideal (27,018), Jihu (24,857), Dongfeng (21,262), and FAW Pentium (20,793).
5) New forces: In October, the retail share of the new forces was 23.9%, an increase of 1.2 percentage points over the previous year. Among the new power models, pure electric sales accounted for 66.9%, a sharp drop from 74.3% in the same period; the share of sales in the 10-150,000 class of new power electric vehicles increased dramatically. Independent new energy brands from independent traditional car companies performed well as second-generation players, with a share of 15.3%, an increase of 0.8 percentage points over the previous year. Self-innovating energy brands from large independent groups such as Jikrypton, Yipai Technology, Aian, Jihu, and Rantu performed well.
6) General mixing: In October, 123,000 ordinary hybrid passenger cars were sold, up 38% year on year and down 2% month on month. Among them are FAW-Toyota (34,794), GAC Toyota (30,540), Geely (19,915), SAIC passenger cars (13,160), Great Wall (10,749), Changan Ford (3,893), Dongfeng Honda (3,329), GAC Trumpchi (2,096), Guangqi (1,752), and Changan (1,525). Autonomous hybrid models such as Geely, SAIC passenger cars, and Changan have risen to prominence in overseas markets.
2. National passenger car market outlook for November 2026
November has a total of 21 working days, which is the same as last year, but there are 2 more days than in October, so the effective production time and sales period in November is longer. November is a time when the car market fluctuates greatly. The external economic environment and seasonal demand will comprehensively affect the car market. Historically, the weak car market often occurred in November.
The effective production and sales period in November was more plentiful than in October. The cooler weather and the return of migrant workers led to the release of car purchases in the county and township markets. There are structural opportunities for new energy and middle- and low-end fuel vehicles. November is a reasonable time to take the initiative to increase inventory: demand is relatively hot at the end of the year. Consumers are in high demand for existing cars in stock, and inventory needs to be prepared early. The current restrictions are that dealers are not confident enough. Some dealers are looking for an opportunity to quit, the channel reservoir function weakens, and there is still a lot of pressure on the market to remove inventory at the end of the year.
The export side shows the characteristics of “moving forward in rhythm and total overdraft”. Exports gradually declined in November. Foreign demand for pre-Christmas car purchases required early transportation, and the shipping window was concentrated until mid-November. Export grabbing will obviously be strong this year: the expected reduction in export tax rebate rates and the tightening of overseas tariff windows form a superimposed incentive. While some orders are delivered early, boosting short-term export data, it is also overdrawing export momentum for the first quarter of next year. This means that November exports supported the wholesale side in a phased manner, and it is inappropriate to extrapolate it linearly as a trend strengthening.
According to the China Statistical Yearbook data compiled by the Passenger Transport Federation Branch, car ownership has surged but the accident rate has declined in a cliff-style manner, and technical safety dividends have been fully released. In eight years, the number of cars owned increased from 232 million to 359 million, an increase of about 54.7%; while the accident rate per 10,000 cars dropped sharply from 7.2 to 3.9, a drop of 45.8%. Against the backdrop of a sharp expansion in the total number of cars, the number of accidents fell by 15.8%, and the number of injured people fell by 29.4%. This fully shows that under strong supervision, the spread of passive vehicle safety (body structure, airbags) and active safety (AEB, assisted driving) technology has significantly reduced bicycle risk, and increased safety confidence is conducive to the popularization of private cars.
“First purchases shrink, swaps dominate” weaken the year-end lag factor. Both ends of the replacement chain are limited at the same time: poor disposal of used cars inhibits exchange conversion efficiency; first-time purchasers have weak income expectations, lengthening the car purchase decision cycle. There is still a balance in the trade-in subsidy, but the marginal effect is diminishing, supporting more than driving growth. The decline in lithium carbonate prices is beneficial to battery costs, but transmission time is delayed, and the beneficiaries are concentrated on leading self-developed battery car companies. Overall, the car market picked up moderately from month to month in November, and the year-on-year decline narrowed. Export rush provided short-term support, but sustainability is questionable. The real recovery of the car market depends on whether the replacement chain can be opened up and consumer confidence can be stopped from falling.
3. Auto industry profit margin 3.3% from January to September 2026, 1.4% sales margin in September
In January-September, large-scale industrial enterprises achieved operating income of 106.21 trillion yuan, an increase of 6.6% over the previous year; operating costs of 90.30 trillion yuan, an increase of 6.1%; and the profit margin on operating income was 5.68%, an increase of 0.44 percentage points over the previous year. From January to September 2026, profits in the electronics industry, driven by artificial intelligence, doubled, and profits in the upstream raw materials industry grew at a high rate, which contributed greatly to the improvement of the overall profit of the industry. However, the automotive industry faced the double pressure of rising costs and weak demand, and profit performance was poor. From January to September 2026, automobile production was 23.37 million vehicles, down 4% year on year, revenue of 80,43.5 billion yuan increased 2.6%, cost of 7162.7 billion yuan increased 3.8%, profit of 267.5 billion yuan decreased 23%, and sales margin was 3.3%; of these, in September, 3.06 million vehicles were produced, sales revenue of 1,037.4 billion yuan increased 0.6%, cost of 925.7 billion yuan increased 2.5%, profit of 14.2 billion yuan, and sales profit margin 1.4%, which is at a low level of nearly 4 years.
In 2026, various regions vigorously promoted the implementation of the “two new” policies to gradually and effectively release the vitality of domestic demand, but the improvement in the efficiency of the automobile industry clearly lags behind other consumer goods. As the country's anti-domestic countervailing efforts continue to advance, the automobile industry is being squeezed upstream, costs have risen significantly, oil prices have skyrocketed, profits from non-ferrous metals and semiconductors have skyrocketed, and the wait-and-see mentality of end users buying cars is serious, causing the operating pressure on car companies to continue to be too high.
4. From January to September 2026, China exported 8.63 million vehicles
From January to September 2026, China achieved exports of 8.63 million vehicles, a year-on-year growth rate of 52%. In September, China achieved exports of 1.18 million vehicles, an increase of 55% over the previous year, and an increase of 13% over the previous year. The overall trend of the automobile market is strong. The main growth drivers this year are still due to high oil prices, increased competitiveness of Chinese products, and continued growth in the global southern markets. Exports from Mexico and the Philippines fell significantly from month to month in September. From January to September 2026, Anhui's automobile exports grew by 115%, and Zhejiang ranked second. The average export price of Shanghai enterprises is high.
The top 10 countries of China's total automobile exports in September 2026: Russia 112,962, the United Kingdom 58,740, Brazil 58,725, Australia 46,559, Belgium 45,369, Thailand 39,323, UAE 39,120, Mexico 38,962, Italy 37,731, and Spain 34,051, with the top five incremental increases over the same period: Russia 43,836, Brazil 34,423, UK 31,173, Thailand 25,615 and 25,024 Italian vehicles. Our exports to Russia recovered significantly from January to September 2026. The top 10 countries with cumulative total vehicle exports from January to September 2026: Russia 752,602, Brazil 539,675, UK 424,173, Australia 373,674, Belgium 367,879, Mexico 361,518, Italy 245,836, UAE 237,970, Philippines 235,933, and Thailand 224,121. Among them, the top five were: Russia 394,809, Brazil 321,527, and the United Kingdom 199,582 150,298 Australian vehicles, and 136,011 Italian vehicles.
Customs data for the full year of this year show the characteristics of the growth rate of various models: the overall trend of passenger cars is strong, and the performance of trucks is poor in September. Pickup truck growth increased in September, heavy truck export performance declined to a high level, and other truck markets showed strong trends. Among buses, the performance of large and medium-sized buses was weak, and the share of light bus exports rebounded to 63% in September.
In September 2026, China exported 612,000 new energy vehicles, up 104% year on year; in January-September, China exported 4.07 million new energy vehicles, up 75% year on year. The performance was very good. In September, NEV exports increased 23% month-on-month.
The top 10 countries of China's total NEV exports in September 2026: Belgium 43,675, UK 43,548, Brazil 42,130, Thailand 37,714, Australia 33,437, Germany 26,465, Spain 24,711, Italy 24,134, Russia 17,520, and the Philippines 17,027. Among them, the top five were: Brazil 30,759, Thailand 25,201, Australia 24,072, UK 24,027, Belgian 22,806 vehicles. The top 10 countries with total NEV exports from January to September 2026: Brazil 379,234, Belgium 351,032, UK 313,638, Australia 270,577, Thailand 213,455, Philippines 205,197, Germany 142,382, Italy 133,234, Spain 131,120, and South Korea 125,164. Among them, the top five were: Brazil 237,917, Australia 161,462, and the United Kingdom 160,373, Belgium 127,500, and Thailand 116,136.
Exports of various types of new energy vehicles are clearly differentiated: exports of pure electric passenger vehicles from January to September 2026 are mainly: Belgium 245,860 units, Thailand 198,551 units, Brazil 196,069 units, Australia 192,382, and the United Kingdom 159,580 units. From January to September 2026, exports of plug-in hybrid passenger cars were mainly: Brazil 181,165, the United Kingdom 151,559, Belgium 101,962, Italy 84,119, and the United Arab Emirates 76,601. The main cumulative exports of plug-in hybrid trucks in 2026 are: Australia: 17,346 units, Argentina 3,849 units, Mexico 2,754 units, Pakistan 2,500 units, Chile 2,220 units, and New Zealand 2,064 units. The main exporters of pure electric buses this year were 2,325 from Nepal, 1,236 from Ethiopia, 829 from Pakistan, and 739 from Israel.
5. From January to September 2026, China imported 290,000 vehicles
In September 2026, 21,000 imported cars were imported, down 49% year on year and 6% month on month. From January to September 2026, 290,000 vehicles were imported, a year-on-year decrease of 20%. Passenger cars account for more than 99% of the automobile import structure this year, making them the absolute dominant position. If pickups in light trucks are included, the number of passenger cars is even higher. The 15% increase in imported hybrid vehicles from January to September 2026 showed good performance. Pure electric passenger cars fell 27%, plug-in hybrid fell 54%, and imported new energy passenger vehicles showed weak performance. The displacement of imported models of passenger cars is concentrated on gasoline models below 2 liters. Last year, 3-4 liters had a better ability to withstand falling, and this year it changed to 1.5-2 liters, which is relatively good.
The downward pressure on imported cars in September was still strong. The top 10 countries with the highest imports in September 2026 are: Japan with 7,399 vehicles, Germany with 7,255 vehicles, the United Kingdom with 2,488 vehicles, Slovakia with 1,418 vehicles, Mexico with 818 vehicles, the United States with 791 vehicles, Austria with 355 vehicles, Belgium with 112 vehicles, South Korea with 95, and Italy with 90 vehicles. Among them, the top five increases in the current period compared to the same period were: Mexico 307, Austria 107, Belgium 42, South Korea 41, and France 16. The top 10 countries with the highest imports from January to September 2026 are: Japan with 136,652 vehicles, Germany with 66,438 vehicles, 28,350 US vehicles, Slovakia with 20,422 vehicles, the United Kingdom with 18,803 vehicles, Mexico with 4,974 vehicles, Austria with 4,193 vehicles, Thailand 2,270 vehicles, Italy with 786 vehicles, and South Korea with 760 vehicles. Among them, the top five increased in the current period compared to the same period: Thailand with 2,027 vehicles, Austria with 1,948 vehicles, Mexico with 1,576 vehicles, China with 540 vehicles, and South Africa with 373 vehicles.
From January to September of this year, the retail sale of 250,000 imported cars fell 32%. The performance was poor. In September, it fell to 27,000 units, down 38% from the previous year. The performance is very poor, and the pressure is still high. Demand for domestic and imported luxury cars in the domestic market is generally weak. Among them, the luxury car market in Beijing, Shanghai, Hangzhou, Chengdu, Shenzhen and other regions is under high pressure. Demand from northern and central western oil-producing regions such as Xinjiang and Shandong is strong this year.
6. From January to September 2026, China's sales volume accounted for 32% of the world's automobile share
According to World Automobile Organization statistics, global automobile production continues to grow, reaching 96.38 million units in 2025, an increase of 5% from 91.77 million units in 2024. China accounts for 35.4% of the world's production share. Global automobile sales continue to grow, reaching 96.89 million units in 2025, an increase of 6%, and China accounts for 35.4% of world sales. From January to September 2026, the world's automobile sales volume was 72.52 million units, up 3% year on year; of these, sales volume in September was 8.74 million units, up only 2% year on year, up 12.4% month on month, and the growth momentum of the global car market was weak.
From January to September 2026, the cumulative global automobile sales volume was 72.52 million units. By country, China sold 23.27 million vehicles, with a share of 32.1%, a marked drop from 35.4% in 2025; the US sold 12.3 million units, with a share of 17.0%, a slight decline; and India performed well, increasing its share to 6.7%, becoming a highlight of growth. Judging from changes in share over the years, China's share of the world continued to rise from 2022 to 2025, and reached a phased high in 2025. The overall share of major European countries has been declining steadily, while the share of emerging markets such as Brazil and Russia has remained stable. The decline in sales volume in the Chinese market in the first 9 months of 2026 is the core reason for changes in global share. The rapid growth in emerging markets such as India has to some extent hedged the growth pressure of the Chinese and US markets and supported the global car market to maintain a slight positive growth.
From east to west, with the exception of Toyota, Hyundai, Kia, Suzuki, and Tata, the share of other international brands declined sharply in 2026. Compared with 2019, China's own brands have increased their overall share of the world this year. Geely, BYD, Chery, SAIC, Changan, etc. performed well independently. The trend of electrification development in the world has also led to the gradual weakening of some established international car companies. In addition to favorable factors in the Indian market such as Suzuki, the share of other international brands has declined significantly across the board.
7. From January to September 2026, China's new energy passenger vehicles account for 63% of the world's new energy vehicles
From January to September 2026, the world's new energy passenger vehicles reached 18.38 million units, up 15% year on year. Of these, sales of new energy vehicles in September were 2.65 million units, up 16% year on year, up 18% month on month, and the growth rate returned to normal historical levels. From January to September 2026, the share of new energy vehicles reached 25.3%, with pure electric vehicles accounting for 17.8% and plug-in hybrids for 7.6%. The performance is excellent, with hybrids accounting for 8%.
European new energy passenger vehicles sold 3.86 million units in 2025, an increase of 960,000 units over the same period last year, an increase of 33%. According to preliminary statistics, Europe had 544,000 new energy passenger vehicles in September, up 38% year on year, and 3.68 million from January to September 2026, up 35% year on year. Due to price increases due to high tariffs and the cancellation of new energy subsidies, sales of new energy vehicles in the US were 120,000 units in September 2026, down 44% year on year. In January-September, sales of new energy vehicles in the US were 950,000, a decrease of 32%.
The overall penetration rate of new energy vehicles in the world is showing a rapid upward trend. It has reached 13.1% in 2022, 15.9% in 2023, 19.5% in 2024, and 23.6% in 2025. In 2026, the penetration rate of new energy vehicles in the world was 25.3%. Among them, Germany reached 34.2%, Norway reached 83%, the United Kingdom 36.7%, while the US only had 7% and Japan only 4%, so the imbalance in the world's NEV development is extremely obvious.
From January to September 2026, China's share of new energy passenger vehicles reached 63% of the world, and reached a good level of 65.5% in the third quarter. Among them, pure electricity: China's share of the world's pure electric vehicle market was 59% in 20261-9. At the beginning of the year, China's pure electric vehicle performance was poor due to the Spring Festival, reaching 62% in the third quarter; among them, plug-in: from January to September 2026, China's share of plug-in hybrids in the world reached a high level of 71%, reaching 74% in the third quarter, and China showed excellent performance in the world plug-in hybrid market.
In 2025, the overseas sales share of autonomous new energy passenger vehicles reached 15.8%, an increase of 6.2 percentage points. In 2026, the overseas market sales share of autonomous new energy passenger vehicles increased dramatically, reaching 27.8% in September, a further sharp jump of 12 percentage points.