
National Presto Industries (NPK) Earnings Jumped, Is It Still 9% Below Fair Value?
Why National Presto Industries’ Earnings Jolt Matters
National Presto Industries (NPK) just posted quarterly results with sharp year-over-year gains in revenue and EPS, helped by stronger Defense shipments, a tariff refund in Housewares, and a conservative balance sheet.
That earnings jolt has landed in a stock that has already been on a strong run. National Presto Industries’ share price is up 33.22% year to date and the 1 year total shareholder return is 33.37%, while the 3 year total shareholder return of 96.32% signals momentum that has been building rather than fading.
Scan other defense and industrial stocks showing similar earnings momentum with the curated 36 high quality undervalued stocks that pair balance sheet strength with current pricing that may not fully reflect recent results.
After a 33% year to date climb and a recent post earnings slip, National Presto Industries now trades about 9% below one intrinsic estimate and roughly 12% under the US$162 analyst target. Where does fair value really land?
Preferred P/E of 23.8x: Is it justified?
On current numbers, the market is valuing National Presto Industries at a P/E of 23.8x, which is below both the US Aerospace & Defense industry average of 27.2x and the peer average of 28.6x. The share price at $142.55 sits in that gap where the multiple is cheaper than many rivals even after a strong total return over 1 and 3 years.
The P/E ratio compares what investors are willing to pay for each dollar of current earnings. For a business like National Presto Industries, which splits its operations across Defense, Housewares and Safety products, that benchmark gives you a quick way to measure how its profit stream is being priced against other listed defense and industrial stocks.
Here the signal is mixed. The stock trades on a lower P/E than sector and peer averages, which points to more conservative expectations baked into the price. At the same time, the estimated fair P/E of 16.2x is well below the current 23.8x, which is a wide gap that the market could eventually close if sentiment or earnings trends reset closer to that level.
Explore the SWS fair ratio for National Presto Industries.
Result: Preferred multiple of price-to-earnings of 23.8x (OVERVALUED).
Still, a business like National Presto Industries leans heavily on Defense contracts and big ticket ammunition orders, so any procurement delays or policy shifts could quickly undermine that valuation gap narrative.
Find out about the key risks to this National Presto Industries narrative.
Another View: DCF Says National Presto Industries Is Cheaper Than It Looks
The P/E view presents National Presto Industries as expensive relative to a fair ratio of 16.2x. However, the SWS DCF model points in the opposite direction. At $142.55, the stock price is about 9.2% below an estimated future cash flow value of $157.04. Which signal do you rely on when they disagree?
Look into how the SWS DCF model arrives at its fair value.
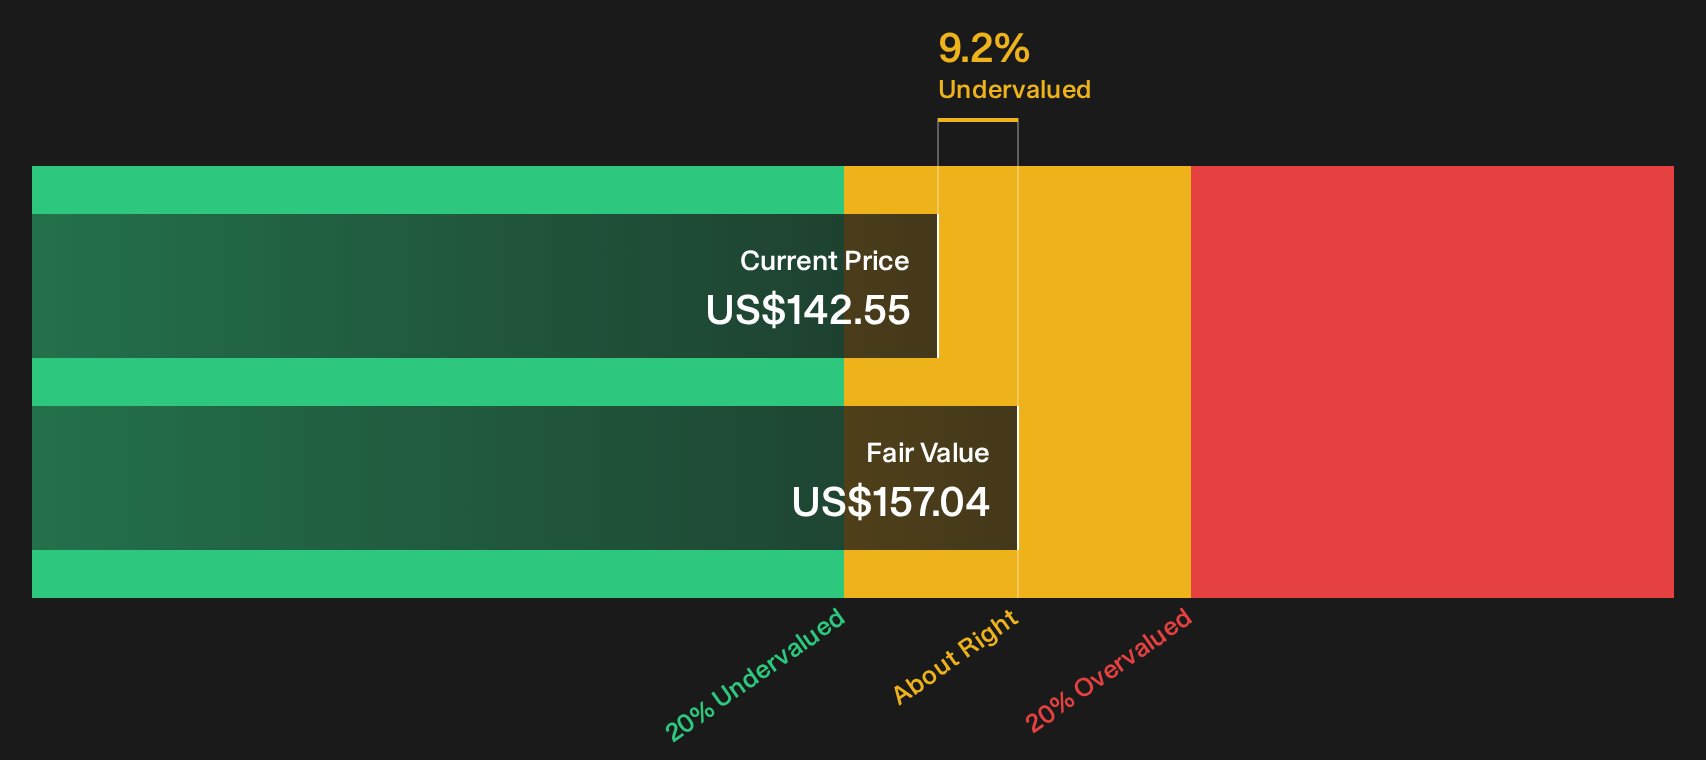
Simply Wall St performs a discounted cash flow (DCF) on every stock in the world every day (check out National Presto Industries for example). We show the entire calculation in full. You can track the result in your watchlist or portfolio and be alerted when this changes, or use our stock screener to discover 36 high quality undervalued stocks. If you save a screener we even alert you when new companies match - so you never miss a potential opportunity.
Next Steps
If this mix of signals around National Presto Industries feels nuanced, that is the point. Consider reviewing the information promptly, validating the numbers yourself and weighing up the 3 key rewards.
Looking for more investment ideas beyond National Presto Industries?
If National Presto Industries has sharpened your focus, do not stop here. Broader idea generation can help you spot opportunities you might otherwise miss.
- Supercharge your search for quality by checking companies that currently screen as resilient and financially steady through the 31 resilient stocks with low risk scores.
- Capture potential value gaps by reviewing the 19 high quality undiscovered gems that combine solid fundamentals with relatively low market attention.
- Zero in on financial strength by using the list of solid balance sheet and fundamentals (25 results) to track businesses with robust balance sheets and consistent fundamentals.
Have feedback on this article? Concerned about the content? Get in touch with us directly. Alternatively, email editorial-team@simplywallst.com