
Hokuriku Electric Power (TSE:9505) Stock Dropped, So What Is Driving Attention Now?
Hokuriku Electric Power (TSE:9505) raised its full year earnings outlook and lifted its second quarter dividend, even though half year net income and earnings per share were lower than in the same period a year earlier.
The latest guidance upgrade and higher interim dividend come at a time when Hokuriku Electric Power’s share price has fallen 6.2% over the past week and 4.9% over the last month. However, a 9.7% 90 day share price gain and 1 year total shareholder return of 20.7% indicate that momentum has built over a longer horizon.
Scan how Hokuriku Electric Power compares with other regulated utilities that combine earnings visibility with shareholder payouts using our curated list of 38 dividend fortresses
Hokuriku Electric Power has raised guidance and the share price has slipped, yet the stock still trades only slightly below the average analyst target while sitting at a sizeable premium to one intrinsic value estimate. Where does fair value really land?
Preferred P/E of 5.6x for Hokuriku Electric Power: Is it justified?
On simple earnings terms, Hokuriku Electric Power looks inexpensive. A P/E of 5.6x compares to an estimated fair P/E of 9.8x and sits well below peer levels, even with the share price at ¥1,012.5 and only a small discount to the average analyst target of ¥1,033.
The P/E ratio compares what you pay today for each unit of earnings the utility generates. For a regulated electricity supplier with relatively visible demand, that yardstick often acts as a quick sense check on how the market is weighing current profits against expected stability and potential future cash generation.
Hokuriku Electric Power trades at a P/E of 5.6x against a peer average of 11.3x and an Asian Electric Utilities average of 13.3x, which is a steep gap. The fair P/E estimate of 9.8x sits well above the current multiple, a level the market could move towards if sentiment shifted closer to that fair ratio view.
Explore the SWS fair ratio for Hokuriku Electric Power.
Result: Price-to-earnings of 5.6x (UNDERVALUED)
Still, the recent share price decline and Hokuriku Electric Power’s sizeable premium to one intrinsic value estimate could quickly challenge a straightforward undervaluation argument.
Find out about the key risks to this Hokuriku Electric Power narrative.
Another view on Hokuriku Electric Power’s value
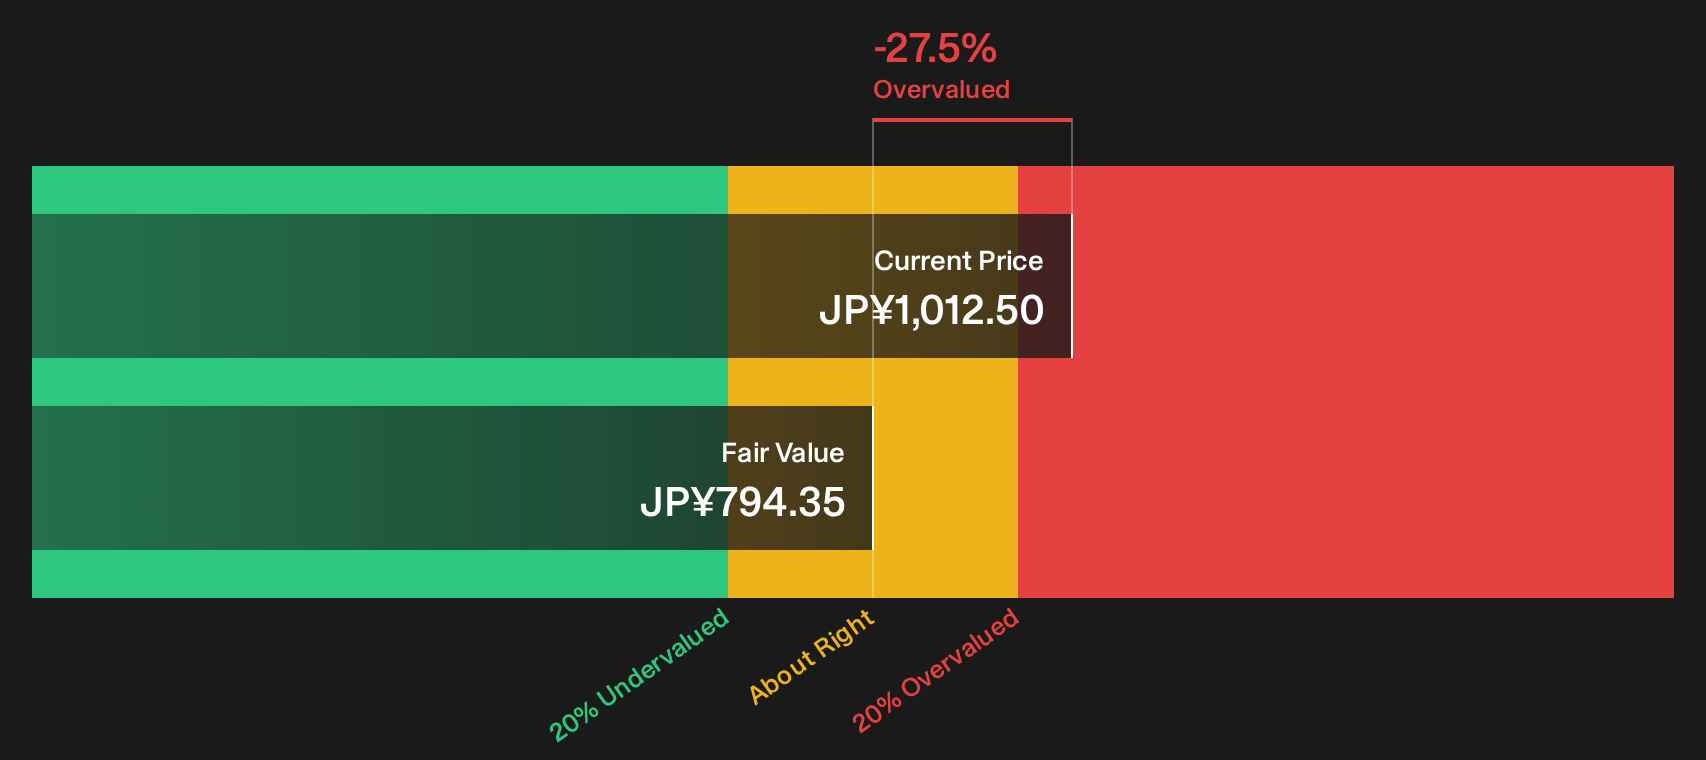
The earnings multiple presents Hokuriku Electric Power as inexpensive, yet the SWS DCF model suggests a different perspective. With the share price at ¥1,012.5 and an estimated future cash flow value of ¥794.35, the stock appears overvalued according to this framework. Which signal would you place more weight on?
Look into how the SWS DCF model arrives at its fair value.
Simply Wall St performs a discounted cash flow (DCF) on every stock in the world every day (check out Hokuriku Electric Power for example). We show the entire calculation in full. You can track the result in your watchlist or portfolio and be alerted when this changes, or use our stock screener to discover 29 high quality undervalued stocks. If you save a screener we even alert you when new companies match - so you never miss a potential opportunity.
Next Steps
If the mixed signals around Hokuriku Electric Power leave you on the fence, that is the point where your own homework matters most. Review both the bullish factors and the caution flags side by side, then ground your stance in the 3 key rewards and 3 important warning signs
Looking for more investment ideas beyond Hokuriku Electric Power?
You have seen how mixed signals can shape one opportunity. Now widen the lens and use structured stock lists to pressure test your next moves.
- Target potential mispricings by scanning a curated set of companies that appear good quality yet priced for caution with the 29 high quality undervalued stocks.
- Prioritise resilience by filtering for businesses that pair sturdy finances with measured risk using the 21 resilient stocks with low risk scores.
- Spot future candidates before the crowd by reviewing a focused pool of quieter quality stocks through the 74 high quality undiscovered gems.
Have feedback on this article? Concerned about the content? Get in touch with us directly. Alternatively, email editorial-team@simplywallst.com