
CNO Financial Group (CNO) Looks Fairly Valued As Earnings And Guidance Improve
CNO Financial Group (CNO) just posted third quarter results with net income of $161.1 million and diluted EPS of $1.71, along with higher full year operating EPS guidance that management lifted by 9% at the midpoint.
The raised guidance lands on a stock that has already had a strong run, with a year-to-date share price return of 33.72% and a 1-year total shareholder return of 41.53%. This builds on very large gains over five years and suggests that momentum has been building rather than fading, despite the 1-day share price decline of 2.25% to US$56.43 around the results.
Spot momentum like CNO Financial Group and line it up against hand-picked insurers and financials screened for quality and valuation with list of solid balance sheet and fundamentals (24 results).CNO Financial Group now trades close to analyst targets after a powerful multi year run and a strong quarter. Does the current valuation still leave enough upside to justify taking fresh risk?
Most Popular Narrative: 1% Undervalued
CNO Financial Group closed at $56.43 against a narrative fair value of $56.75. This points to a very tight valuation gap that still leans slightly in favor of the current share price given the assumed cash flows and discount rate of 7.58%.
Sustained investments in technology modernization and data driven tools, including a three year program of about US$170m to replace aging core systems and roll out new CRM, enrollment and learning platforms, are aimed at improving agent productivity and supporting lower expense ratios and higher net margins over time.
See why 1 investors see CNO Financial Group as 1% undervalued.
Result: Fair Value of $56.75 (UNDERVALUED)
Still, the story around CNO Financial Group can shift quickly if slow premium growth persists or if insider selling continues to signal that expectations already look full.
Find out about the key risks to this CNO Financial Group narrative.
Another View: CNO Financial Group Through The P/E Lens
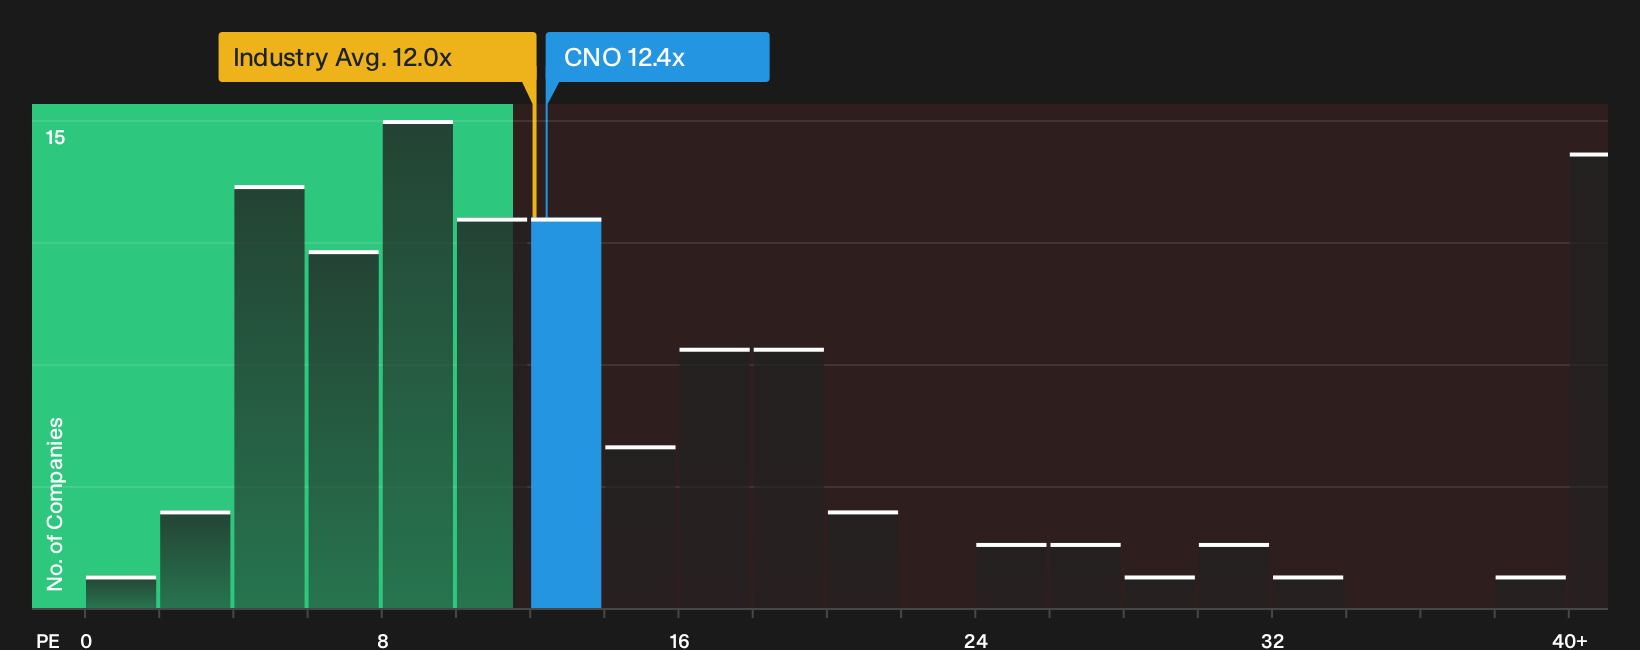
On a P/E basis, CNO Financial Group looks less forgiving. The stock trades on 12.4x earnings, compared with 12x for the wider US insurance group and a peer average of 10.3x. The fair ratio sits at 11.6x, which points to less margin for error if growth or margins soften.
For investors weighing this richer earnings multiple against the cash flow story, it helps to see what the numbers imply about valuation risk and potential mispricing in one place, which you can do in our valuation breakdown via See what the numbers say about this price — find out in our valuation breakdown..
Next Steps
If this mix of optimism and caution around CNO Financial Group feels finely balanced, consider reviewing the full picture of valuation, earnings drivers and capital risks yourself, then weigh those insights against the 3 key rewards and 1 important warning sign.
Looking for more investment ideas beyond CNO Financial Group?
If CNO Financial Group has your attention, do not stop there. Broaden your watchlist with other ideas that match your risk profile and return goals.
- Target resilient balance sheets and steady fundamentals by filtering for companies on the list of solid balance sheet and fundamentals (24 results).
- Hunt for mispriced quality by scanning the 42 high quality undervalued stocks that align with strong cash flows and robust financial footing.
- Prioritise income and staying power by reviewing the 6 dividend fortresses that pair higher yields with underlying business strength.
Have feedback on this article? Concerned about the content? Get in touch with us directly. Alternatively, email editorial-team@simplywallst.com