
The NASDAQ fell sharply into a technical correction! Retail investors and institutions are fleeing, and short-term fluctuations are likely to increase further
The Zhitong Finance App learned that the Democratic Party's political shock wave that swept through both houses of the US Congress in the midterm elections was delayed and detonated in the US stock market. As the market feared that most of the new legislation would tighten supervision of artificial intelligence (AI) related spending and data center construction, on Thursday, technology stocks were “bloodwashed” and the AI hardware industry chain was collectively sold off. As a result, the Nasdaq Composite Index fell sharply. The closing price was more than 11% lower than the historical high set last month, falling into a technical correction range.
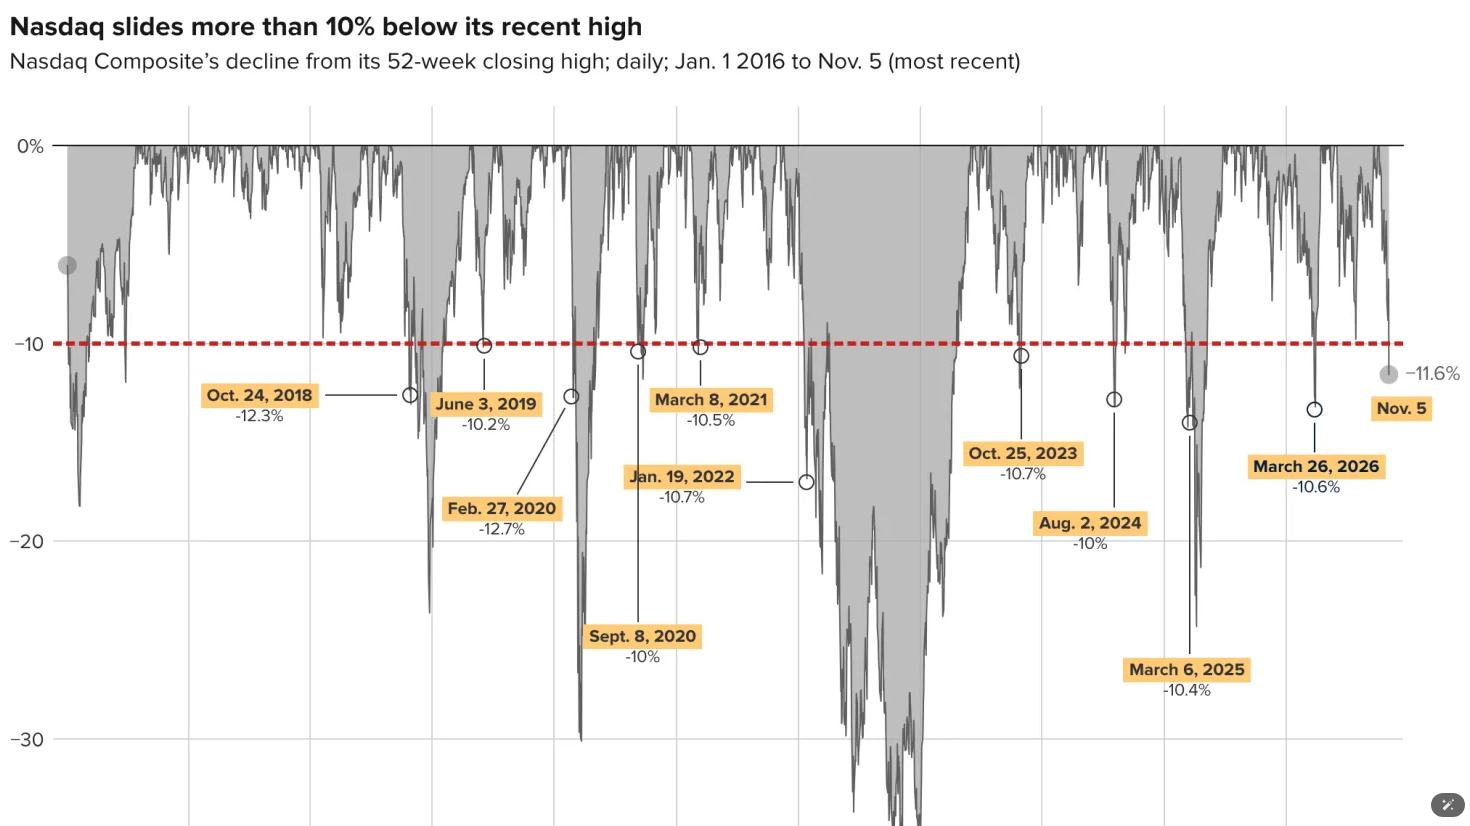
The central narrative of Thursday's sell-off is the market's repricing of the AI capital expenditure cycle. Michael O'Rourke, chief market strategist at JonesTrading, put it bluntly: “Data center construction will substantially slow down due to the political landscape, and profit expectations that supported previous multiple arguments have failed. Investors have no idea where these expectations will be reset, so until they have a new clear judgment, they can only continue to reduce their risk exposure — and this process won't end anytime soon.”
The market is worried that the Democratic Party may push for four types of AI tightening policies: limiting data center expansion. Democratic Congressman Sanders put forward an extreme proposition to suspend AI data center construction; requiring data centers to fully bear grid access costs; increasing taxes on data centers and AI services; retaining state-level supervision and strengthening investigations. If the relevant measures are implemented, they may drive up AI investment costs and prolong the construction cycle.
Some economists said that with the Democratic Party winning both houses, AI supervision pressure will increase, and the Democratic Party will get more powers to review investigations, funding, and personnel appointments, but most ordinary laws still require 60 votes in the Senate and face presidential veto restrictions. The market may see the sweep as a precursor to the 2028 political party rotation, taking into account the risk of increasing taxes and strengthening AI regulation ahead of time.
Retail investors and institutions are fleeing
According to data from Vanda Research, retail investors abandoned their iconic bargain buying strategy on Thursday and instead sold individual stocks. The sell-off speed set the fastest record since the worst period of the market collapse caused by the COVID-19 pandemic in March 2020.
Vanda Research pointed out that the scale of retail sell-off in the first 30 minutes of Thursday set the record for the largest single 30-minute sale in recent months, close to the peak when retail investors fled in panic at the end of July 2024. The agency added that shortly before closing, retail net capital outflows to individual stocks reached US$338 million. The sell-off set the record for the third-largest single-day clearance of individual stocks by retail investors, after March 12 and March 17, 2020.
As retail investors retreat, institutional investors are also reducing their risk exposure more widely, while systemic selling pressure continues to increase. Vanda analyst Viraj Patel pointed out that earlier this week, institutional investors' ability to buy call options had fallen to its lowest level in a year. Meanwhile, leveraged exchange-traded funds (ETFs) are under pressure to rebalance before closing, and are expected to reach 42 billion to 48 billion US dollars. Furthermore, funds that target volatility are simultaneously reducing their risk exposure.
Viraj Patel warned that institutional buyers chose to exit at a time when retail investors and systemic strategies are selling stocks in a big way. This pattern of capital flows is extremely rare and will rarely occur unless the market is under severe pressure.
According to reports, after the opening of the US stock market on Thursday, a large number of sell-offs poured into the futures market almost simultaneously. A number of senior traders described the liquidity situation at the time as “extremely characteristic of clearance,” and pointed out that procedural sales of algorithms and CTA funds exacerbated the initial straight line decline without buying.
UBS pointed out that retail-led sales triggered the futures market's risk control system and forced liquidation of leveraged ETFs. UBS further warned that the sales volume of systemic funds (especially risk control funds) is still expected to exceed 100 billion US dollars on Friday, and this round of adjustments may not have bottomed out.
What's going to happen next?
However, historical data shows that the sell-off may intensify in the short term, but the market will usually eventually recover after three months. Cappthesis founder Frank Cappelleri used the previous US midterm election cycle as a reference and found that historical experience also showed that the market may face more fluctuations in the short term. The chart analyst said that of the 13 midterm election cycles since 1974, the NASDAQ index rose 12 months after the election ended, except for one. “It is important to note that this process may be accompanied by sharp fluctuations,” he said.
Using 2018 as an example, Frank Cappelleri pointed out that the NASDAQ index rose the day after the Democratic Party won a seat in the House of Representatives that year. Subsequently, the market experienced a sharp sell-off in December, but in the end, the index rose by about 15% a year after the election.
Looking back at 10 technical pullbacks in the past decade, the NASDAQ experienced a further sharp decline in the following month after the sell-off wave in 2025, 2022, 2020, and 2018. However, with the exception of 2022, in all of the above cases, the NASDAQ re-entered an upward trend after six months — the technical correction in January 2022 brought more severe results. Within the next six months, the NASDAQ fell further by 18.3%, reaching 24.3% a year later. Overall, from the bottom of the technical correction, the NASDAQ rose by an average of 9.41% over the next three months and an average increase of 17.03% over the next six months.
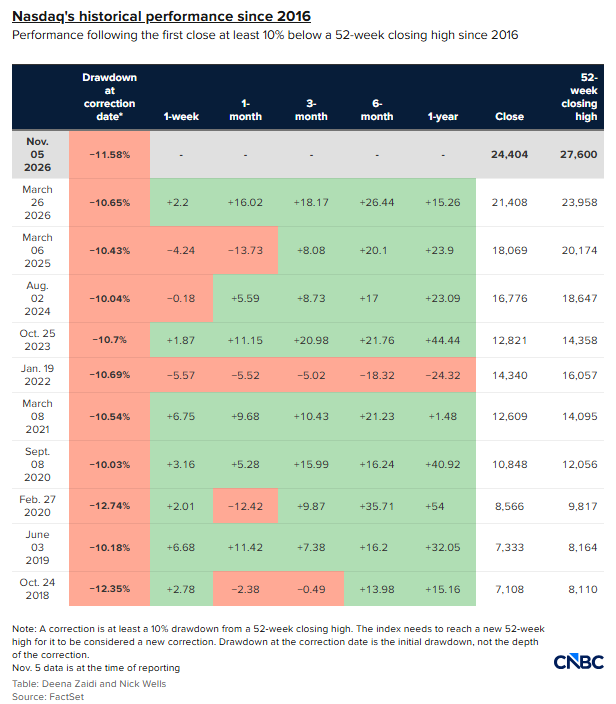
Market analysts are divided on the next trend. Senior Wall Street tech analyst Dan Ives believes that chip stocks still have 10% to 12% of downside, while Tom Lee, co-founder and head of research at Fundstrat, known as the “magic operator of Wall Street,” characterized this round of AI sell-off as an “overreaction” and expects technology stocks to rebound 20% from current levels.
Charlie McEligott, a cross-asset strategist at Nomura Securities, pointed out that the current negative gamma position in the market is “huge”, which means that price declines will continue to amplify the trend. The Goldman Sachs CTA model estimates that if the market falls further, the S&P 500 will face systemic selling pressure of about 164 billion US dollars. Jonathan Krinsky, BTIG's chief technical strategist, warned that rotation requires buyers on both sides. Healthcare is already 19% above the 200-day EMA, the highest in history, and defensive buying is weak. As a result, he believes that the next round of defensive buying lacks a source of funding.