
Learn Why The Bull Case For RS Group Stock Could Change Following Half Year Results
- RS Group reported half year 2027 results for the period to 30 September 2026, with sales of £1,544.3 million and net income of £87.8 million, alongside basic earnings per share from continuing operations of £0.19 and diluted earnings per share of £0.189.
- The combination of higher sales and net income, together with firmer earnings per share, indicates that RS Group’s operating model continued to convert top line activity into profit through the half.
- We will now look at how RS Group's investment narrative is affected by this half year uplift in sales and earnings.
RS Group Investment Narrative Recap
To own RS Group, you need to believe that its mix of broad MRO distribution, RS PRO private label and higher value services can keep turning scale into resilient earnings, even when some regions or product sets feel soft. The latest half year, with higher sales, net income and EPS, suggests that the model is still converting activity into profit.
The most important short term swing factor remains execution on efficiency and digital projects, because organic OpEx has been running toward the top of guidance. Weakness in areas like Mexico and semiconductors still hangs over volume and margin. This half year uplift helps, but does not fully resolve those operational risks.
The key fresh data point is the half year 2027 earnings release itself, which puts hard numbers on RS Group progress. Sales of £1,544.3m, net income of £87.8m and basic EPS of £0.19, all above the prior year, provide an updated read on how the business is handling tougher end markets while still funding technology and process investment.
That release matters because the narrative around integration, automation and digital tooling ultimately needs to show up in reported profit, not just presentation slides. Firmer EPS from continuing operations suggests some traction in cost control and mix. The open question for investors is how consistently RS Group can sustain that while still carrying heavier organic OpEx and dealing with underperforming geographies.
What The RS Group Consensus Is Really Pricing In
RS Group's analyst narrative rests on a relatively steady top line climb and a firmer profit conversion over the next few years, rather than a dramatic reset. Forecasts point to revenue growth of 4.7% a year and a shift in profit margins from 5.6% today to 7.0% in three years. This assumes the operational projects and mix changes already under way keep gaining traction rather than stalling.
On earnings, the consensus view anchors on profit today of £162.0 million moving to £231.7 million by about 2029, which is roughly a 43% uplift in absolute terms. Some analysts push that story further with upside scenarios as high as £299.8 million. The spread between the cautious and punchier cases is wide enough that investors are really choosing where along that range their own expectations sit.
The timeframe matters. Forecasts cluster around 2029 as the year when the full effect of efficiency work, RS PRO expansion and integration of acquisitions are expected to show through the income statement. That same year is also the reference point for a 19.1x P/E multiple that many brokers are using in their models, compared with about 22.3x on current earnings according to the report summary.
RS Group's narrative projects £3.3b revenue and £231.7m earnings by 2029. This assumes 4.7% yearly revenue growth and an earnings increase of about £69.7m from current earnings of £162.0m.
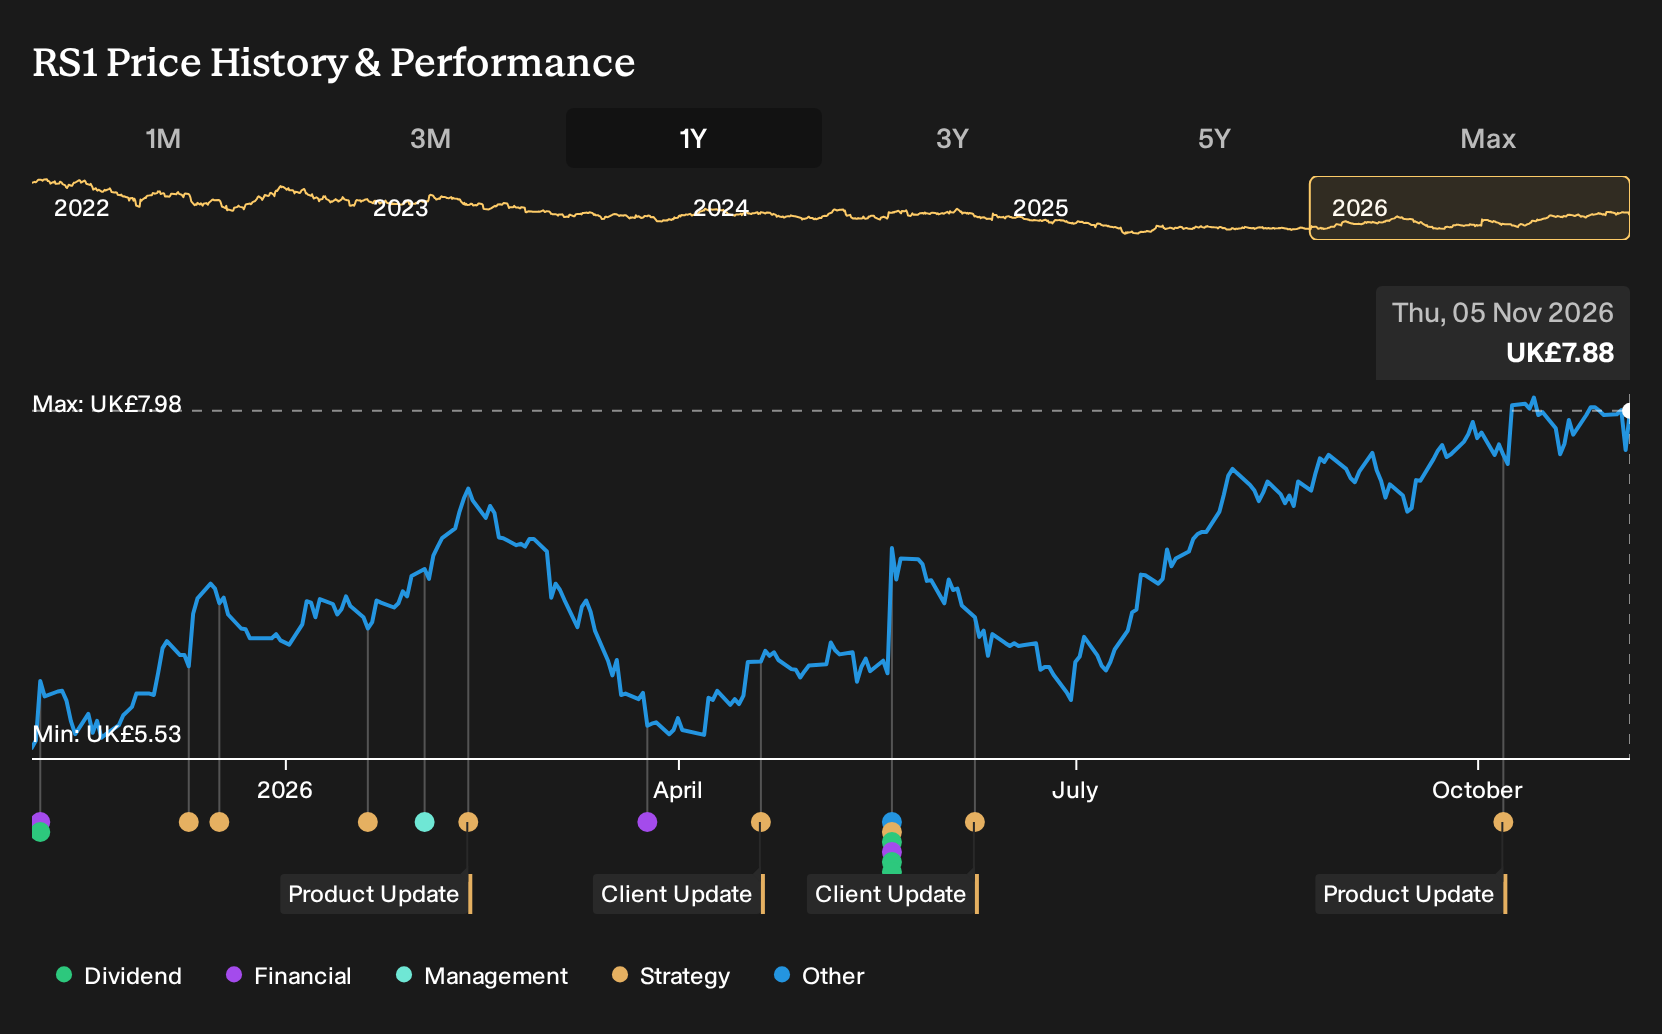
The forward valuation debate then becomes fairly simple to frame. At a consensus price target of £7.68 and a current share price quoted at £7.85, the gap is only 2.2% and analysts on average describe the stock as roughly fairly priced against their own numbers. Price targets still range from £5.20 to £9.00, so there is meaningful disagreement baked into the sell side on how much of the planned margin lift and earnings build will actually land by the end of the decade.
Uncover why RS Group's fair value indicates a 3% potential downside to its current price, which leaves little room for error.
Exploring Other Perspectives
One alternative angle focuses on RS Group using its cash and balance sheet more aggressively. Bullish analysts were already modelling about £3.5b of revenue and £298.1m of earnings by 2029, well above the consensus £3.3b and £231.7m. The latest half year figures may nudge those optimistic assumptions, or cause some to cool them. Readers should expect opinions to move in both directions as analysts update their models.
Explore 3 other RS Group fair value estimates, including one that suggests it could be worth as much as £8.01.
Reach Your Own Conclusion
Don't just follow the ticker. Dig into the data and build a conviction that's truly your own.
- A great starting point for your RS Group research is our analysis highlighting 4 key rewards that could impact your investment decision.
- See our latest analysis for RS Group. The report includes a comprehensive fundamental analysis summarized in a single visual, the Snowflake, making it easy to evaluate RS Group's overall financial health at a glance.
Looking For More Investment Ideas Beyond RS Group?
If RS Group has sharpened your interest in earnings quality and balance sheet strength, it can be useful to put those themes in context by comparing it with other businesses that share similar traits. The Simply Wall St Screener helps you scan the market using the same kind of fundamental filters that underpin this analysis, so you can build a broader watchlist that fits your own risk and return preferences.
- For investors who want potential upside without stretching quality too far, use the screener to track 5 high quality undiscovered gems that combine resilient fundamentals with room for the market to catch up.
- If capital preservation matters most to you, narrow the field to companies with steadier profiles by focusing on our 4 resilient stocks with low risk scores that already clear a stricter risk filter.
- When balance sheet strength tops your checklist, start with the list of solid balance sheet and fundamentals (9 results) and look for businesses that pair manageable debt with consistent cash generation.
Have feedback on this article? Concerned about the content? Get in touch with us directly. Alternatively, email editorial-team@simplywallst.com