
W. R. Berkley (WRB) Beats On Q3 Earnings, Is It Still Overvalued?
Q3 earnings beat and fresh shelf registration put W. R. Berkley in focus
W. R. Berkley (WRB) drew fresh attention after reporting third quarter 2026 operating income of $1.17 per share that topped analyst expectations, alongside a universal shelf registration covering multiple security types.
Recent trading action suggests investors are leaning into the story. The share price has climbed 2.12% in the past day, 7.09% over the last week and 9.95% across the past month, with W. R. Berkley now at $76.71. A 5.53% 1-year total shareholder return sits alongside a 3-year gain of 81.94% and a 5-year return of 138.99%, pointing to long term holders still being well ahead even as short term momentum picks up around the Q3 beat and fresh shelf registration.
Scan how W. R. Berkley compares with other insurers reacting to earnings surprises and fresh capital flexibility by checking the hand picked 31 resilient stocks with low risk scores in this space.
For W. R. Berkley, a modest earnings beat and a fresh universal shelf have arrived alongside a sharp one month gain. Is this move related to business fundamentals or primarily a shift in sentiment toward the stock, and what might that imply for valuation next?
Most Popular Narrative: 10.5% Overvalued
Against the most followed narrative fair value of $69.41, W. R. Berkley at $76.71 is priced richer, with that view built on detailed underwriting and capital return assumptions discounted at 7.24%.
The expanding complexity of global business and assets is driving demand for specialty insurance solutions. W. R. Berkley is building on this with mid single digit gross and net premium growth in its Insurance segment, alongside current accident year ex cat combined ratios around 89%, which can support revenue and underwriting income.
See why 7 investors see W. R. Berkley as 11% overvalued.
Result: Fair Value of $69.41 (OVERVALUED)
Still, the thesis on W. R. Berkley can be tested if softening commercial pricing squeezes underwriting margins, or if pressure in property and reinsurance curbs premium volume.
Find out about the key risks to this W. R. Berkley narrative.
Another View: SWS DCF Model Points To Upside
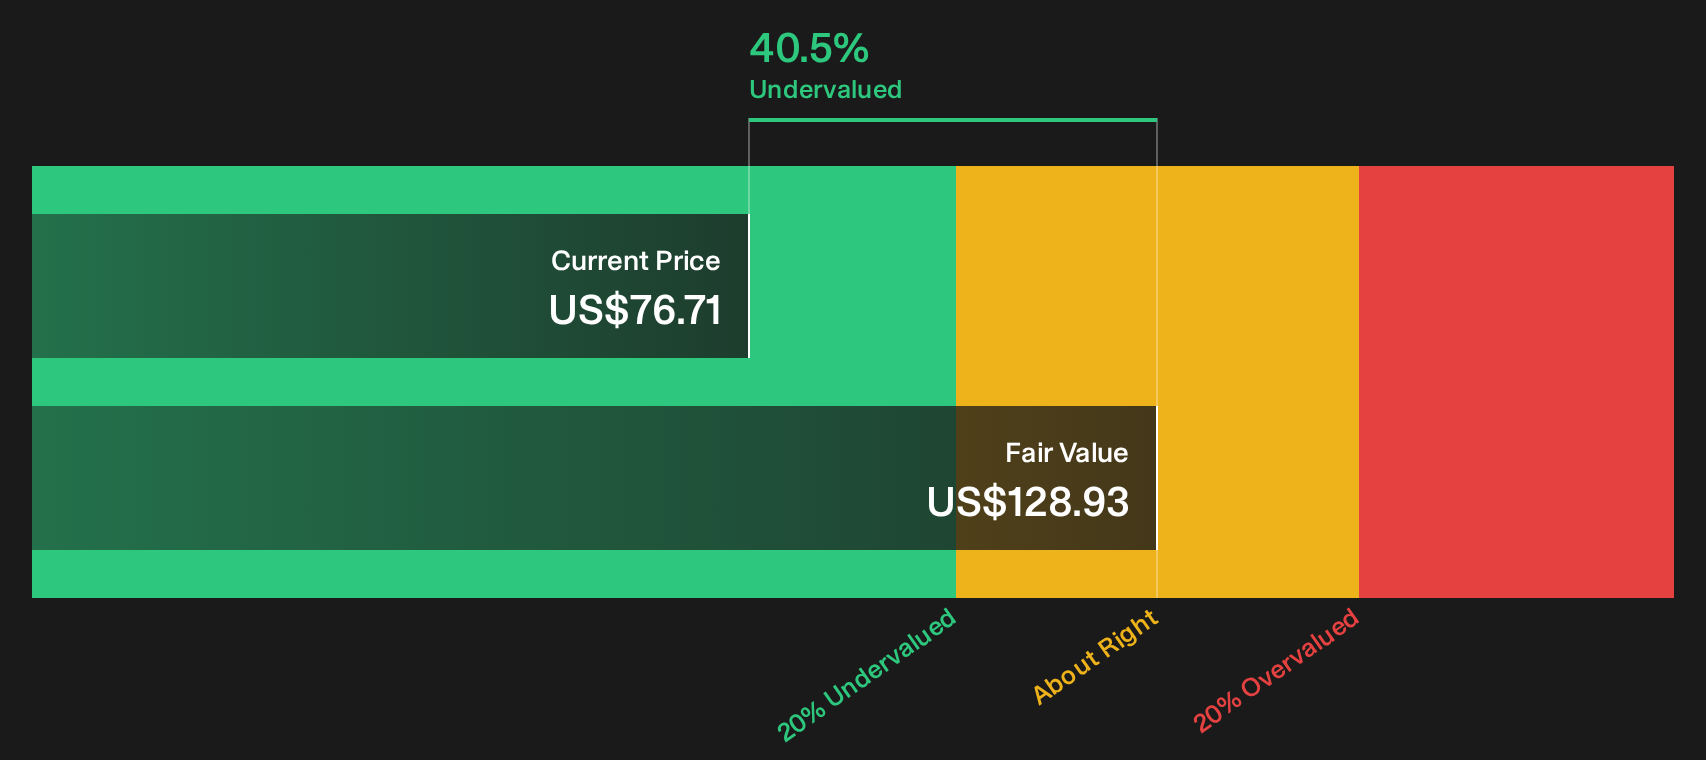
The analyst narrative pegs W. R. Berkley at roughly 10.5% above its fair value of $69.41, yet the SWS DCF model paints a very different picture. On that framework, WRB at $76.71 trades about 40.5% below an estimated future cash flow value of $128.93, which raises a simple question. Is the gap about cautious earnings assumptions or about how investors are pricing long term cash generation?
If cash flows drive your process more than headline multiples or consensus targets, it can be useful to see how that SWS DCF model builds up to $128.93 and what would need to change for that value to compress or expand from here. Look into how the SWS DCF model arrives at its fair value.
Simply Wall St performs a discounted cash flow (DCF) on every stock in the world every day (check out W. R. Berkley for example). We show the entire calculation in full. You can track the result in your watchlist or portfolio and be alerted when this changes, or use our stock screener to discover 35 high quality undervalued stocks. If you save a screener we even alert you when new companies match - so you never miss a potential opportunity.
Next Steps
Mixed signals around W. R. Berkley can leave the story feeling finely balanced, with real risk and reward in play. Act while the data is fresh, review the figures yourself carefully, and pressure test both sides of the argument with the 1 key reward and 1 important warning sign.
Looking for more W. R. Berkley sized ideas?
If W. R. Berkley has you rethinking your watchlist, use this moment to refresh your broader opportunity set and stress test where your capital works hardest.
- Spot potential mispricings early and review the 35 high quality undervalued stocks that combine strong fundamentals with prices that may not fully reflect them.
- Strengthen portfolio resilience by scanning the list of solid balance sheet and fundamentals (24 results) that can help anchor your returns when conditions turn tougher.
- Get ahead of the crowd by tracking the 19 high quality undiscovered gems before they attract wider market attention.
Have feedback on this article? Concerned about the content? Get in touch with us directly. Alternatively, email editorial-team@simplywallst.com