
Fidelity National Financial (FNF) Sees ETF Flows Reverse, Is The Stock Still Undervalued?
ETF flows into Fidelity National Financial (FNF) reversed on 2 November, as RDIV exited its entire position and several funds turned net sellers after four sessions of net buying.
Recent trading has been volatile for Fidelity National Financial. The share price closed at US$43.28 after a 1-day share price return of 4.57% and a 7-day share price return of 10.13%, yet the 90-day share price return is down 17.62% and the year-to-date share price return is down 20.27%. Over the longer term, the 3-year total shareholder return of 15.95% and 5-year total shareholder return of 12.13% point to a more mixed picture, with fading near term momentum contrasted against more modest gains for patient holders.
Scan how Fidelity National Financial compares with a curated 35 high quality undervalued stocks that have solid cash generation and balance sheets, attracting attention when ETF flows shake up the usual trading patterns.
After a sharp bounce but a weak year-to-date profile, Fidelity National Financial now asks a simple question of you as a holder or potential buyer: Does the balance of risk and reward still lean your way from here?
Most Popular Narrative: 17% Undervalued
On the most followed narrative, Fidelity National Financial screens as undervalued, with a fair value of $52.25 versus the last close at $43.28. This puts the current drawdown and recent volatility into a different light for long term holders weighing ETF selling against fundamentals.
Ongoing digital investment, including the fully deployed inHere platform with roughly 80% residential engagement and new features such as property monitoring, continues to support higher productivity per file and can help sustain Fidelity National Financial’s title margins in the mid to high teens, which feeds into future earnings power.
See why 27 investors see Fidelity National Financial as 17% undervalued.
Result: Fair Value of $52.25 (UNDERVALUED)
Still, the narrative around Fidelity National Financial can break if residential real estate remains subdued for longer and quarterly results continue to miss analyst expectations.
Find out about the key risks to this Fidelity National Financial narrative.
Another View: What The P/E Ratio Says About Fidelity National Financial
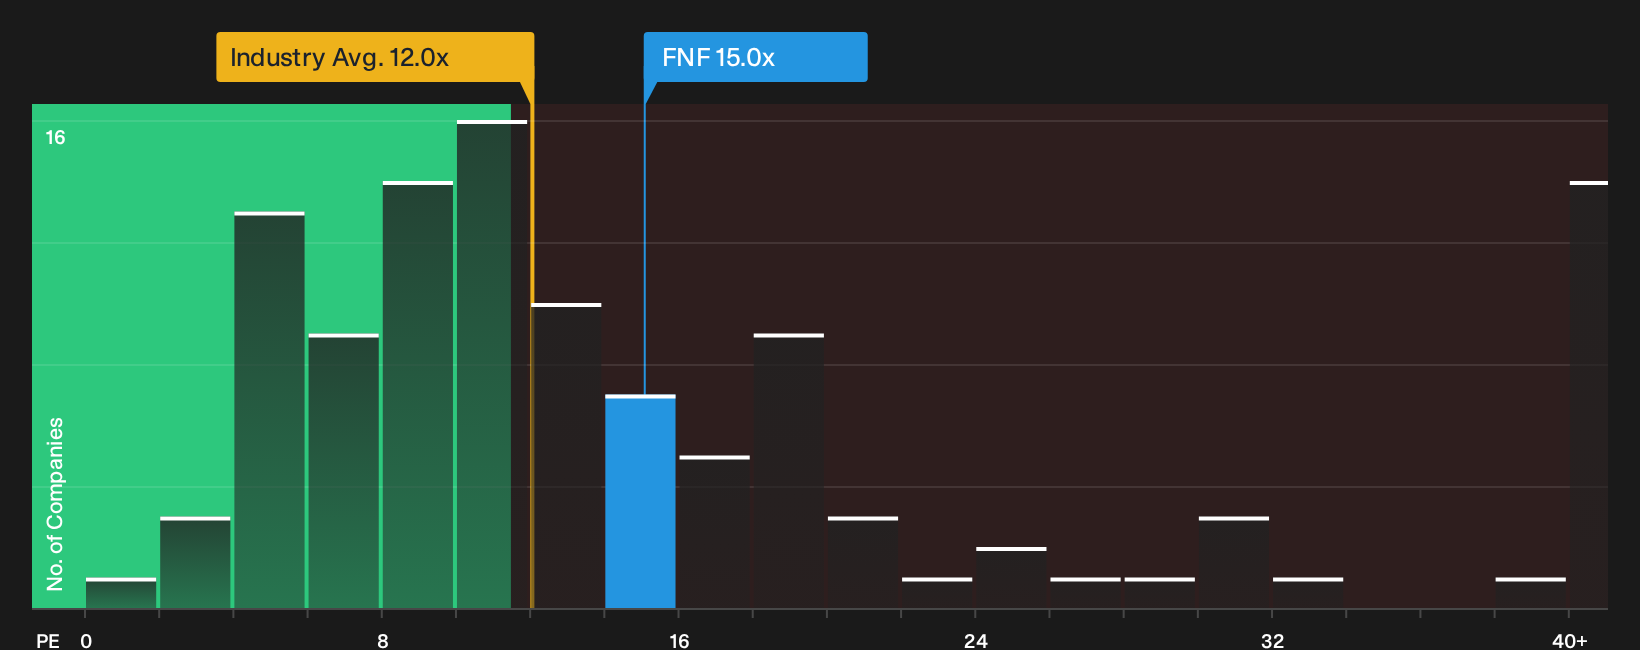
Analyst narratives point to Fidelity National Financial trading below a fair value of $52.25, yet the P/E ratio tells a more cautious story. FNF trades on roughly 15x earnings, a touch above the 14.8x peer average and well above the 11.8x US Insurance sector, while the fair ratio sits close by at 15.5x.
That gap suggests only a modest margin of safety if earnings fall short or if sentiment toward the sector cools. The question is whether this setup feels like a reasonable entry point or a tightrope.
For a closer look at how this earnings multiple stacks up against what the numbers imply the market could move toward, See what the numbers say about this price — find out in our valuation breakdown.
Next Steps
Mixed messages or early reset, either way the recent moves around Fidelity National Financial only matter if you use them to sharpen your own thesis. To see the full balance of concerns and potential upsides before you act, review the 4 key rewards and 1 important warning sign.
Looking for more ideas beyond Fidelity National Financial?
Once you have a view on Fidelity National Financial, widen the lens. Fresh ideas often come from comparing different business models, risks, and balance sheet profiles side by side.
- Target steadier compounding by scanning a 31 resilient stocks with low risk scores that filters for resilience when you want potential upside without stretching your risk tolerance.
- Hunt for potential mispricing by reviewing a 19 high quality undiscovered gems that highlights quality businesses the market may not be focused on yet.
- Anchor your watchlist in financial strength by checking a list of solid balance sheet and fundamentals (24 results) so you are not caught off guard when conditions get tougher.
Have feedback on this article? Concerned about the content? Get in touch with us directly. Alternatively, email editorial-team@simplywallst.com