
BKV (NYSE:BKV) exceeds Q3 2026 revenue expectations, but adjusted EPS miss

Natural gas producer BKV (NYSE:BKV) reported Q3 2026 results exceeding the market’s revenue expectations, with revenue up 72.2% year on year to $478.4 million. Its non-GAAP profit of $0.36 per share was 11.4% below analysts’ consensus estimates.
For more on BKV, read the full research report for free.
BKV (BKV) Q3 2026 highlights:
- Revenue $478.4 million vs S&P analysts’ consensus estimates of $400.3 million (72.2% year-on-year growth, 19.5% beat)
- Adjusted EPS $0.36 vs S&P analysts’ consensus estimates of $0.41 (11.4% miss)
- Operating margin 14.1%, down from 29.6% in the same quarter last year
- Free cash flow $82.99 million, up from -$10.77 million in the same quarter last year
- Oil production per day up 51.7% year on year
- Market capitalization $2.09 billion
“Our upstream business delivered another strong quarter, with continued operational outperformance providing a solid foundation as we advanced our strategic growth initiatives,” said Chris Kalnin, Chief Executive Officer of BKV. “We also made meaningful commercial progress in our power business, securing a cost reimbursement agreement for modular generation equipment and a previously announced backstop agreement with an investment-grade hyperscaler supporting our CCGT equipment commitments.”
Revenue growth
Cyclical sectors like energy often flatter weaker operators during favorable price environments, but a longer-term lens separates those from businesses that can consistently perform across market cycles. BKV’s 19.8% annualized revenue growth over the last five years was strong. Its growth beat the average energy upstream and integrated energy company and shows its offerings resonate with customers.
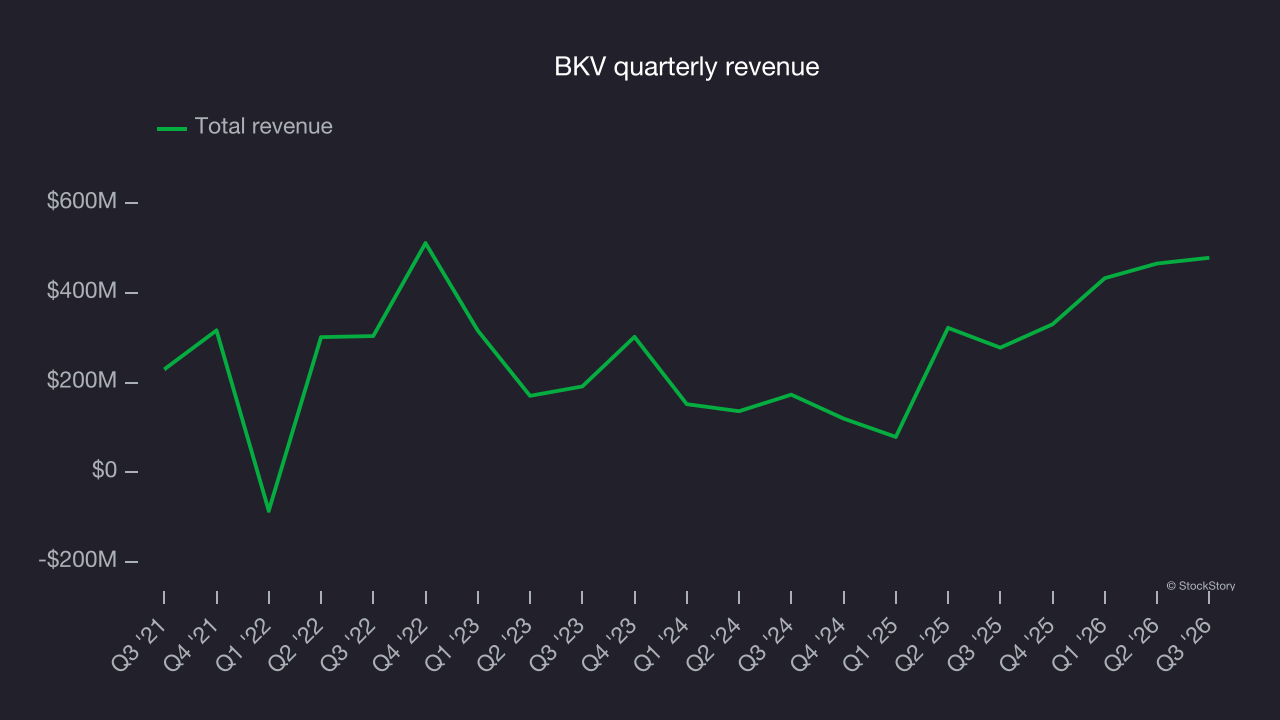
This quarter, BKV reported year-on-year revenue growth of 72.2%, and its $478.4 million of revenue beat Wall Street’s consensus estimates by 19.5%. Oil production per day grew 51.7% year on year.
Adjusted EBITDA margin
BKV has managed its cost base well over the last five years. It demonstrated solid profitability for an upstream and integrated energy business, producing an average EBITDA margin of 38.9%.
Analyzing the trend in its profitability, BKV’s EBITDA margin decreased by 54.8 percentage points over the last year. Even though its historical margin was healthy, shareholders will want to see BKV become more profitable in the future.
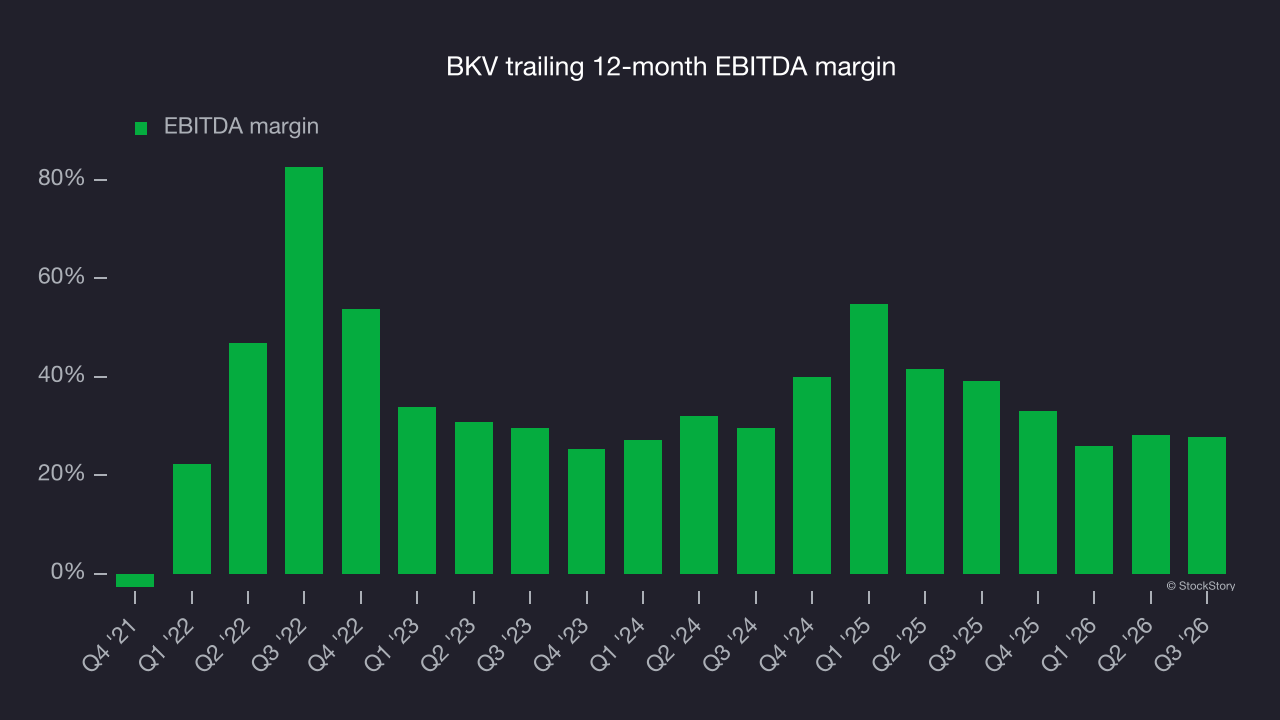
This quarter, BKV generated an EBITDA margin of 26.5%, in line with the same quarter last year. This indicates the company’s overall cost structure has been relatively stable. Its adjusted EBITDA fell short of Wall Street’s consensus estimates.
Free cash flow
As mentioned above, adjusted EBITDA ignores capital structure and drilling expenditure decisions. These are two major aspects of an energy producer’s business, so investors need to account for them to assess business quality. In other words, adjusted EBITDA margins could be solid but free cash flow abysmal because asset decline rates are high and drilling is expensive. Free cash flow tells you not only about the economics of past production but also how much it costs to stay in business through further drilling or extraction.
While BKV posted positive free cash flow this quarter, the broader story has been less consistent. BKV’s demanding reinvestments have consumed substantial resources over the last five years, contributing to an average free cash flow margin of negative 1%. This means it burned $1.04 in cash for every $100 in revenue.
The level of free cash flow is important, but its durability across cycles is just as critical. Consistent margins are far more valuable than volatile swings driven by commodity prices.
BKV’s ratio of quarterly free cash flow volatility to Henry-Hub gas-price volatility over the past five years was 36 (lower is better), indicating that its cash generation is far more sensitive to commodity-price swings than most peers. This elevated volatility limits its access to capital in downturns and makes it unlikely to act as a consolidator when weaker competitors come under pressure.
This stability analysis compares free cash flow with commodity prices. Why not compare revenue or EBITDA to Henry Hub in the case of BKV? Because what ultimately matters is not how much revenue or profit a company earns when prices are high but how much cash it can generate when prices are low. Free cash flow is the superior metric because it includes everything from hedging effectiveness to growth and maintenance capex to management behavior during good times and bad.
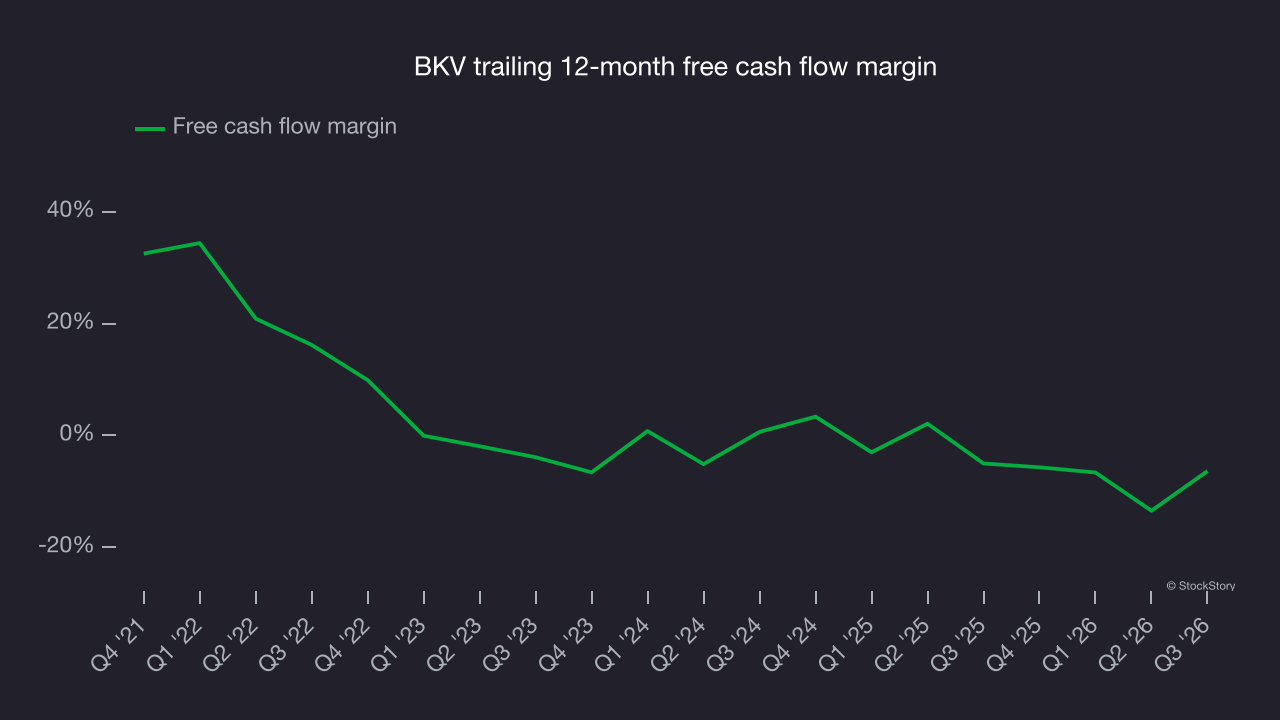
BKV’s free cash flow was $82.99 million in Q3, equivalent to a 17.3% margin. Its cash flow turned positive after being negative in the same quarter last year, but the short-term improvement warrants caution because investment needs can be seasonal, leading to temporary swings. Long-term trends are more important.
Key takeaways from BKV’s Q3 results
BKV’s sizable revenue beat was a key positive this quarter, but EPS missed expectations, leaving a mixed set of results. Shares remained flat at $19.11 immediately after the release.
Is BKV a buy at its current price? What happened in the latest quarter matters, but not as much as longer-term business quality and valuation when deciding whether to invest in this stock. For more on BKV, read our full research report here (it’s free).