
TransUnion (TRU) Jumped, What Is Behind The Latest Attention?
TransUnion (TRU) just delivered a busy October, pairing a positive third quarter earnings release with fresh fourth quarter and full year 2026 guidance, as well as a modest cash dividend increase.
Recent trading has reflected that news flow. TransUnion’s 1 month share price return of 28.69% and 7 day gain of 10.52% suggest momentum has picked up sharply. However, year to date the share price is still down 1.44% and the 5 year total shareholder return is down 25.05%, leaving the latest rally set against a mixed longer term record.
Scan how investors are rewarding similar earnings momentum by comparing TransUnion’s move with a curated set of 35 high quality undervalued stocks.
Bulls see TransUnion’s earnings beat, guidance and dividend bump as the start of a reset. Bears see a sharp rebound on a still weak 5 year record. Which story does the valuation support next?
Most Popular Narrative: 9% Undervalued
TransUnion last closed at $82.13 while the most followed narrative pegs fair value at $90.19, using an 8.11% discount rate to weigh future cash flows against today’s price.
The main factor that needs to work in the company’s favor is the continued shift in its business mix toward areas such as insurance, international bureaus and fraud and identity solutions so that revenue is less sensitive to U.S. mortgage volumes and tri merge rule changes.
The current valuation suggests investors are still assigning a cautious multiple to TransUnion, even though some see the company as undervalued and believe its growth, margin and capital return profile is not fully reflected in the share price.
See why 10 investors see TransUnion as 9% undervalued.
Result: Fair Value of $90.19 (UNDERVALUED)
Still, the TransUnion story can break if mortgage inquiry volumes weaken further, or if higher legal, regulatory and funding costs keep squeezing profitability longer than expected.
Find out about the key risks to this TransUnion narrative.
Another View: What Multiples Say About TransUnion
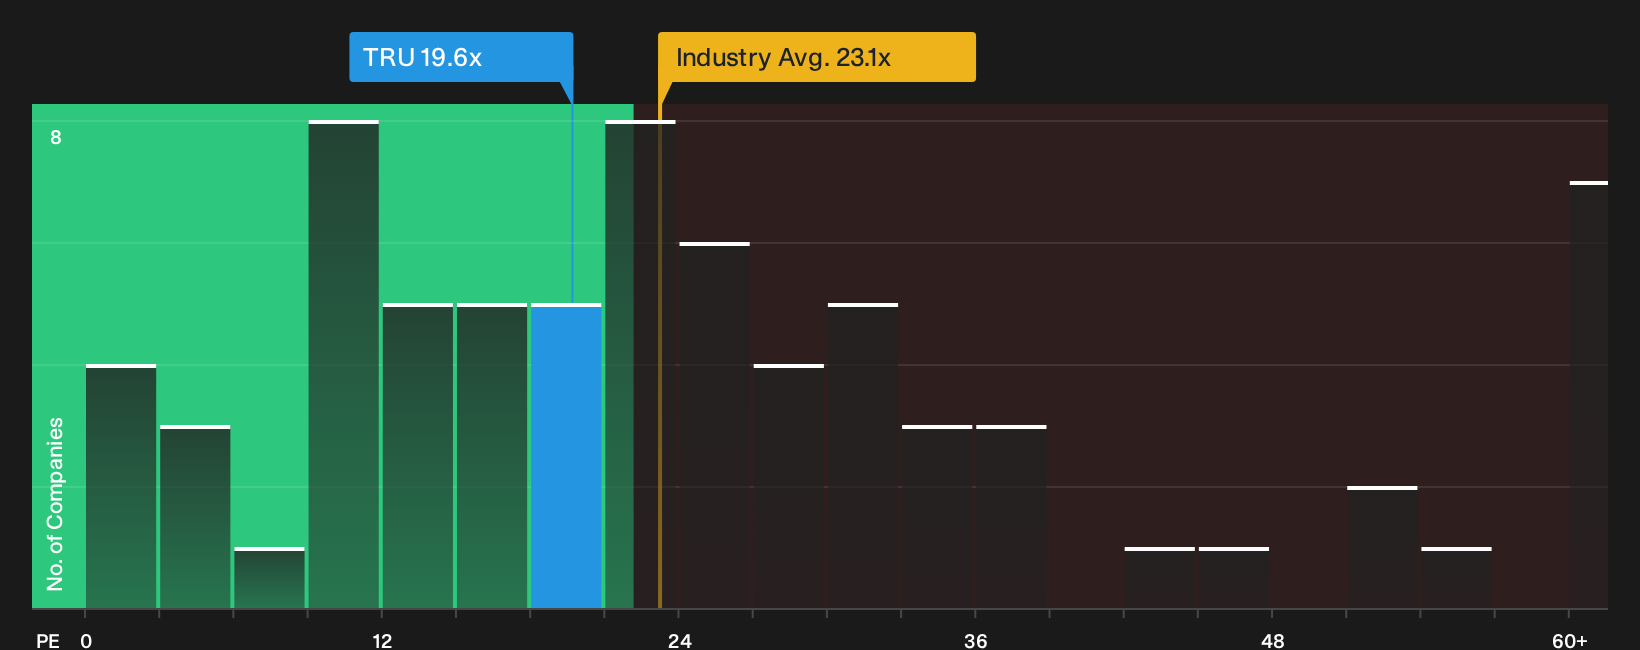
TransUnion may screen as 9% undervalued on the fair value narrative, yet the current P/E of 19.6x sits slightly above its own fair ratio of 19x while still below the US Professional Services average of 23.2x and a 30.4x peer group level. That mix of mild premium to fair ratio but discount to sector and peers points to a more balanced picture, leaving you to decide whether the risk sits in the earnings assumptions or in the multiple catching up.
See what the numbers say about this price in more detail in our valuation breakdown, including how that P/E gap could close over time, through the See what the numbers say about this price — find out in our valuation breakdown.
For a visual read on how TransUnion’s earnings multiple compares with the wider industry, review the latest chart in
Next Steps
Sentiment on TransUnion is split, with optimism about the reset sitting right beside concern about the risks. Act while the data is fresh and pressure test both sides for yourself by weighing the 2 key rewards and 3 important warning signs.
Looking for more investment ideas beyond TransUnion?
You have fresh data on TransUnion. Now widen the lens and pressure test your next moves by scanning other opportunities that match your risk, return and income goals.
- Target potential mispricing by reviewing a curated 35 high quality undervalued stocks that pair solid fundamentals with market skepticism.
- Lock in income candidates by sorting through a focused 5 dividend fortresses that combine high yields with durable payouts.
- Reduce portfolio stress by filtering for a 31 resilient stocks with low risk scores designed to highlight companies with more resilient risk profiles.
Have feedback on this article? Concerned about the content? Get in touch with us directly. Alternatively, email editorial-team@simplywallst.com