
HBT Financial (HBT) Could Be 52% Below Fair Value On Strong Q3 Earnings
HBT Financial (HBT) just paired a fresh earnings update with a new dividend declaration, giving investors fresh data on both profitability and cash returns as of late October 2026.
Recent earnings and the fresh dividend decision appear to be feeding into the share price story, with HBT Financial now trading at $37.81 after a 1-day share price return of 2.22% and a year-to-date share price return of 47.06%.
See how HBT Financial compares with other banks that reward shareholders with both earnings strength and cash returns by reviewing the curated 5 dividend fortresses.
After a 47% year to date surge and stronger reported earnings, HBT Financial now presents a sharper question for investors: Does the current price still leave enough potential upside to justify taking on new risk, or has most of the reward already been claimed?
Price-to-Earnings of 15.4x: Is it justified?
HBT Financial now trades at a P/E of 15.4x, a level that sits above both its banking peers and the wider US Banks industry, even after the strong share price run to $37.81.
The P/E ratio compares the current share price to earnings per share and effectively shows how many dollars investors are paying today for each dollar of profit. For a regional bank like HBT Financial, that figure often reflects how investors view the durability of earnings, the quality of the loan book, and the consistency of management execution more than short term headlines.
Recent data points help explain why the market is willing to pay a higher multiple. Earnings have grown 9.4% per year over the past 5 years and rose 14.1% over the last year, which is faster than that longer term average. Net income of $89.374m on revenue of $291.802m also points to solid profitability, and the earnings are flagged as high quality, with forecasts calling for earnings growth of about 24.4% per year and revenue growth of around 17.4% per year. Return on equity of 11.9% is described as low, yet the stock is also indicated as trading 51.7% below one estimate of fair value at $78.28 according to the SWS DCF model. This suggests investors may be weighing current profitability against stronger forecast growth.
On pure comparison, the P/E of 15.4x is clearly rich. It is described as expensive against the US Banks industry average of 11.3x and also expensive versus a peer group on 11.9x, which signals that the market is assigning a premium to HBT Financial's earnings profile. That premium is also slightly above an estimated fair P/E of 15.1x, which is the level the ratio could converge toward if sentiment cooled or earnings delivery fell closer to sector norms.
Explore the SWS fair ratio for HBT Financial.
Result: Price-to-Earnings of 15.4x (OVERVALUED)
Still, a richer P/E and a premium to one fair value estimate could reset quickly if HBT Financial faces credit quality issues or slower revenue growth.
Find out about the key risks to this HBT Financial narrative.
Another View: What The SWS DCF Model Says About HBT Financial
The story looks different when you swap the P/E lens for the SWS DCF model. On that framework, HBT Financial at $37.81 is described as trading about 51.7% below an estimated future cash flow value of $78.28, which points to undervaluation instead of an expensive stock.
DCF work focuses on cash that might be earned over time rather than what peers trade on today, so it can flag opportunity where market multiples look stretched. With one method describing HBT Financial as pricey and the other implying a wide discount, which lens do you give more weight?
Look into how the SWS DCF model arrives at its fair value.
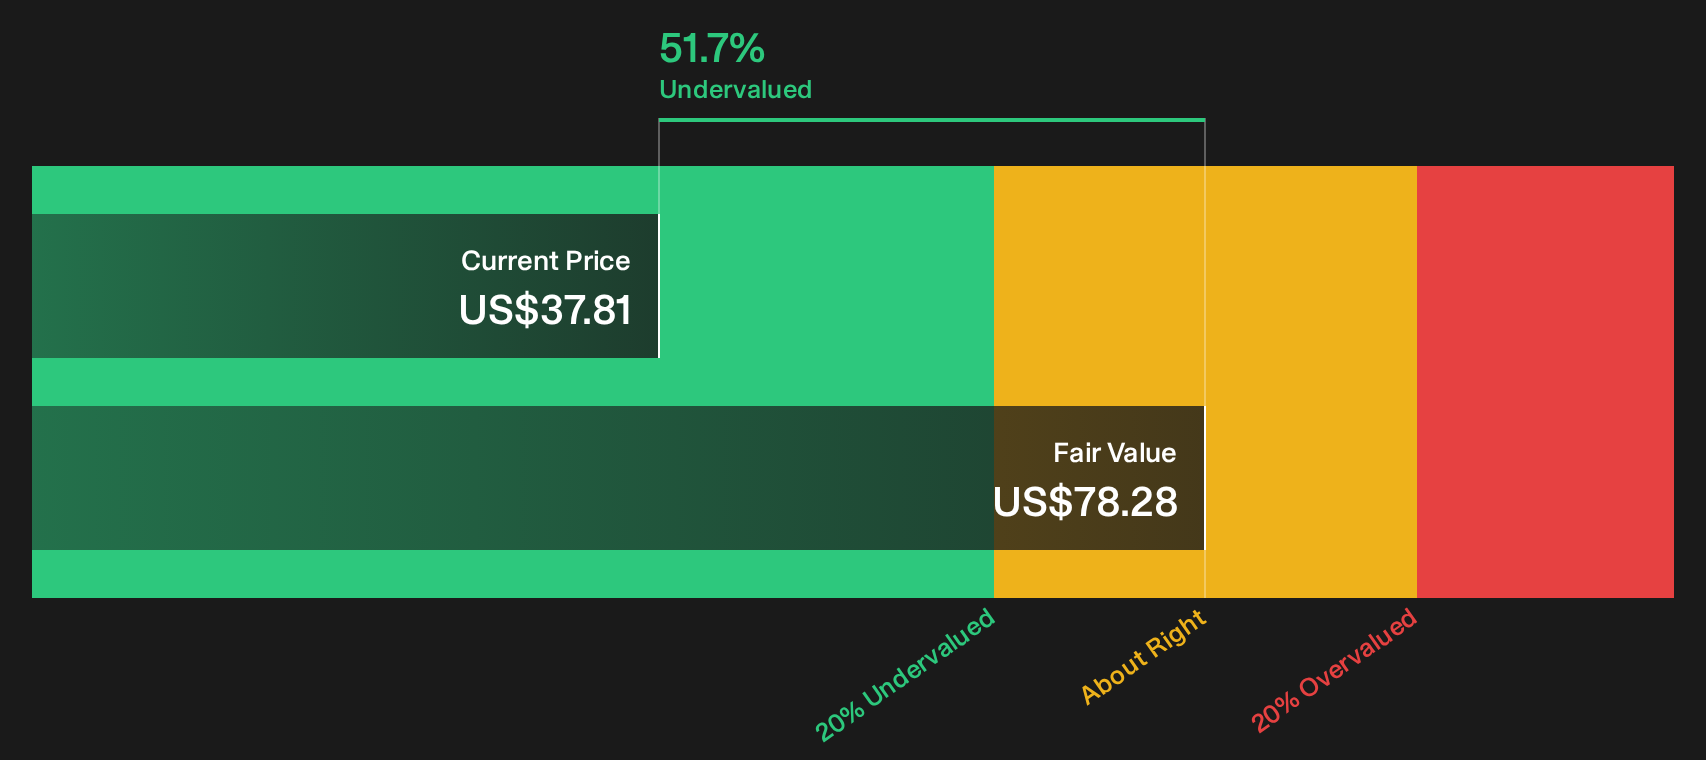
Simply Wall St performs a discounted cash flow (DCF) on every stock in the world every day (check out HBT Financial for example). We show the entire calculation in full. You can track the result in your watchlist or portfolio and be alerted when this changes, or use our stock screener to discover 35 high quality undervalued stocks. If you save a screener we even alert you when new companies match - so you never miss a potential opportunity.
Next Steps
If the mixed signals on HBT Financial leave you undecided, move quickly from reading to testing the numbers yourself and weigh both sides of the story using the 3 key rewards and 1 important warning sign.
Looking for more HBT Financial style investment ideas?
If HBT Financial has sharpened your focus on valuation, dividends, and balance sheet strength, do not stop here. Fresh opportunities often sit just beyond the first idea.
- Target resilient performers by reviewing a 31 resilient stocks with low risk scores that may help you focus on businesses with steadier risk profiles.
- Hunt for potential value gaps with a 35 high quality undervalued stocks that can highlight companies where fundamentals and price look out of sync.
- Balance growth with staying power by scanning a list of solid balance sheet and fundamentals (24 results) that filters for firms with robust financial foundations.
Have feedback on this article? Concerned about the content? Get in touch with us directly. Alternatively, email editorial-team@simplywallst.com