
Is Banner (BANR) Undervalued As Mixed Q3 Results Leave Its Fair Value In Question?
Banner (BANR) drew fresh attention after reporting third quarter 2026 results that combined higher net interest income with softer earnings per share, sharply lower net charge offs, and a reaffirmed quarterly dividend.
Recent trading captures that mixed message. Banner's share price slipped 1.09% over the last session to US$70.74 but is still up 13.24% year to date. Total shareholder return of 20.63% over one year and 77.12% across three years points to momentum that has been building rather than fading.
Spot opportunities across regional lenders showing similar trading momentum and dividend profiles by scanning our curated 30 resilient stocks with low risk scores.For Banner, a 77% three year total return and a recent dip after mixed quarterly numbers creates a simple fork in the road. Is most of the upside already cashed in, or does the current valuation still leave meaningful room?
Most Popular Narrative: 7% Undervalued
On Simply Wall St's most followed view, Banner screens as modestly undervalued, with a fair value of $75.83 against the latest close at $70.74. That gap hinges on how the bank converts its funding base, technology spending, and the Pacific Financial deal into earnings over time.
The main factor that has to go right is that Banner turns its higher operating expenses from technology and integration work into sustained efficiency gains without undermining its moderate risk profile and credit quality.
The current numbers on earnings, capital returns, and balance sheet strength imply a share price that may not fully reflect this combination of core profitability, low-cost funding, and consolidation potential.
See why 1 investors see Banner as 7% undervalued.
Result: Fair Value of $75.83 (UNDERVALUED)
Still, the story can break if integration costs around Pacific Financial keep flaring up, or if investors start assigning a lower P/E to Banner’s earnings.
Find out about the key risks to this Banner narrative.
Another View: Banner Looks Full on Earnings Ratios
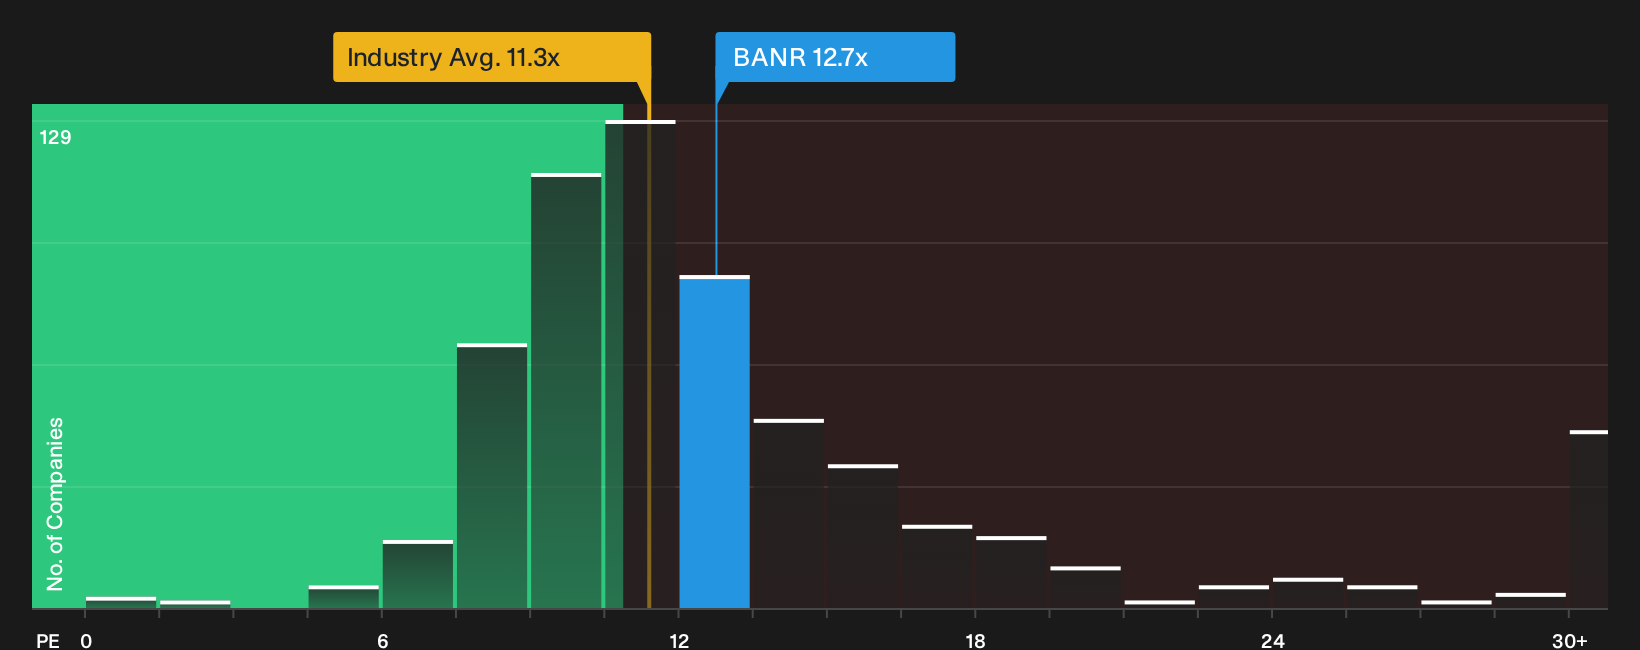
The story changes once you shift from fair value models to simple earnings multiples. On a P/E of 12.7x, Banner trades above the US Banks industry at 11.3x and above its own fair ratio of 12.4x. That premium narrows the margin for error if sentiment cools.
Investors weighing these signals against the earlier fair value estimate may want to see what the numbers imply at different earnings levels and multiples before deciding how much valuation risk feels acceptable, then stress test that view using the See what the numbers say about this price — find out in our valuation breakdown..
Next Steps
Mixed messages on valuation and earnings only get you so far; the rest comes from your own homework and timing. Review the full balance of potential risks and upsides by checking the 2 key rewards and 1 important warning sign.
Looking for more Banner style investment ideas?
If you stop with Banner, you limit your options. Use the Simply Wall St Screener to surface fresh ideas before others even start looking.
- Target value opportunities that pair quality fundamentals with room in the price by checking the 35 high quality undervalued stocks.
- Prioritise resilience first and filter for companies with robust finances using the list of solid balance sheet and fundamentals (23 results).
- Put your cash flow to work and focus on reliable income streams with the 4 dividend fortresses.
Have feedback on this article? Concerned about the content? Get in touch with us directly. Alternatively, email editorial-team@simplywallst.com