
Is Liberty Energy (LBRT) Undervalued As Third Quarter Sales Rose But Earnings Turned To Loss?
Liberty Energy (LBRT) has investors sifting through mixed third quarter numbers. Sales reached US$1,196.16 million, while the period flipped to a US$39.06 million net loss, reshaping the earnings conversation.
Liberty Energy shares last closed at US$14.81, with the 30 day share price return down 23.30% and the 90 day move lower by 23.66%. This suggests investors have been repricing the stock after the third quarter loss and weaker nine month earnings.
Scan for other energy names that could be better set up than Liberty Energy after this earnings setback by focusing on companies in our list of solid balance sheet and fundamentals (23 results).
After a 90 day slide and a fresh quarterly loss, Liberty Energy now sits at a very different price point. Does that reset finally tilt the risk reward back toward buyers, or is it still not cheap enough?
Most Popular Narrative: 45% Undervalued
On the most widely followed narrative, Liberty Energy screens as materially undervalued, with a fair value of $27 against a last close of $14.81. That gap only really makes sense if you think the market is heavily discounting both the completions business and the 3 GW power build out.
The plan to deploy roughly 3 gigawatts of distributed power by 2029, with targeted 5 to 6 year cash on cash paybacks and double digit unlevered returns and a growing set of reservations and ESAs with large data center operators, positions Liberty Energy’s power segment to contribute additional revenue and earnings once these assets are online.
See why 9 investors see Liberty Energy as 45% undervalued.
Result: Fair Value of $27 (UNDERVALUED)
Still, the Liberty Energy narrative can be knocked off course if the US$1.5b capex wave drags on free cash flow or if completions pricing softens during the long power build out.
Find out about the key risks to this Liberty Energy narrative.
Another View: SWS DCF Puts Liberty Energy In A Different Bucket
The popular narrative has Liberty Energy looking 45% undervalued on a $27 fair value. Our DCF model points in the opposite direction. On projected future cash flows, the stock screens as expensive, with a fair value of $8.95 versus the current $14.81 share price.
This gap matters. A P/E based story leans on earnings scaling into the decade. The SWS DCF model instead focuses on cash generation and puts more weight on near to medium term capex and leverage. Which lens you trust more will likely shape how much valuation risk you are willing to accept.
To understand how cash flow assumptions, discount rates and reinvestment needs all feed into this view, it helps to unpack the mechanics behind our DCF work. You can do this through the Look into how the SWS DCF model arrives at its fair value.
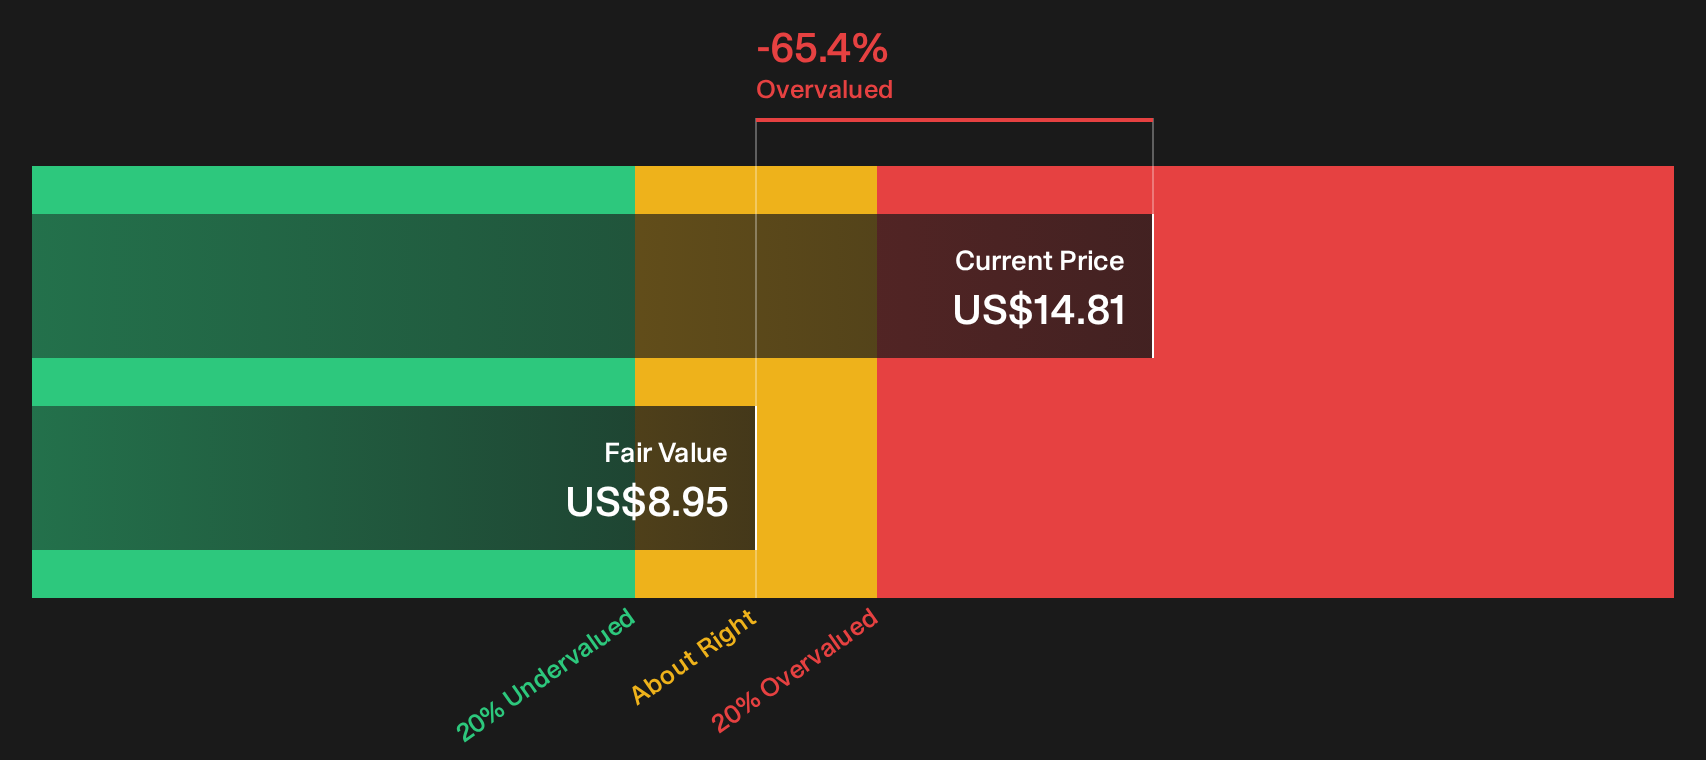
Simply Wall St performs a discounted cash flow (DCF) on every stock in the world every day (check out Liberty Energy for example). We show the entire calculation in full. You can track the result in your watchlist or portfolio and be alerted when this changes, or use our stock screener to discover 35 high quality undervalued stocks. If you save a screener we even alert you when new companies match - so you never miss a potential opportunity.
Next Steps
Mixed signals around Liberty Energy can be confusing, so move quickly from headline impressions to hard numbers and shape your own thesis using the 1 key reward and 4 important warning signs.
Looking for more Liberty Energy investment ideas?
If Liberty Energy has sharpened your focus on pricing, risk and quality, do not stop here. Use the Simply Wall St screener to pressure test fresh ideas and avoid leaving better opportunities on the table.
- Target resilience by scanning companies with strong finances and low leverage using our list of solid balance sheet and fundamentals (23 results).
- Hunt for quality at a discount by reviewing the 35 high quality undervalued stocks filtered by both balance sheet strength and cash generation.
- Build a smoother ride for your portfolio by zeroing in on 30 resilient stocks with low risk scores that have been screened for more resilient fundamentals.
Have feedback on this article? Concerned about the content? Get in touch with us directly. Alternatively, email editorial-team@simplywallst.com