
Ryerson (RYZ) Stock Looks Above Fair Value After Strong Earnings
Ryerson Holding has delivered a sharp share price run, and the question now is whether the current valuation is properly supported by the earnings the business is generating. With the stock having already rewarded holders over the past year, fresh buyers are effectively being asked to pay up today for those same earnings and whatever comes next.
- Ryerson Holding has returned 63.4% over the past year, which puts real pressure on the current earnings to justify the higher entry point for anyone considering the stock now.
- Recent reported results highlighted higher profitability from metal distribution and early merger synergies, which can influence how durable investors think Ryerson Holding's earnings power and margins may be compared with the industry average.
- The analysts covering Ryerson Holding have run their own numbers. See what analysts think Ryerson Holding's shares could be worth.
The issue now is whether Ryerson Holding's current share price fairly reflects its earnings profile when set against the industry average.
If you want more ideas with a similar earnings focus, a good next step is to apply the same lens to 34 high quality undervalued stocks.
Has Ryerson Holding Run Too Far on Earnings?
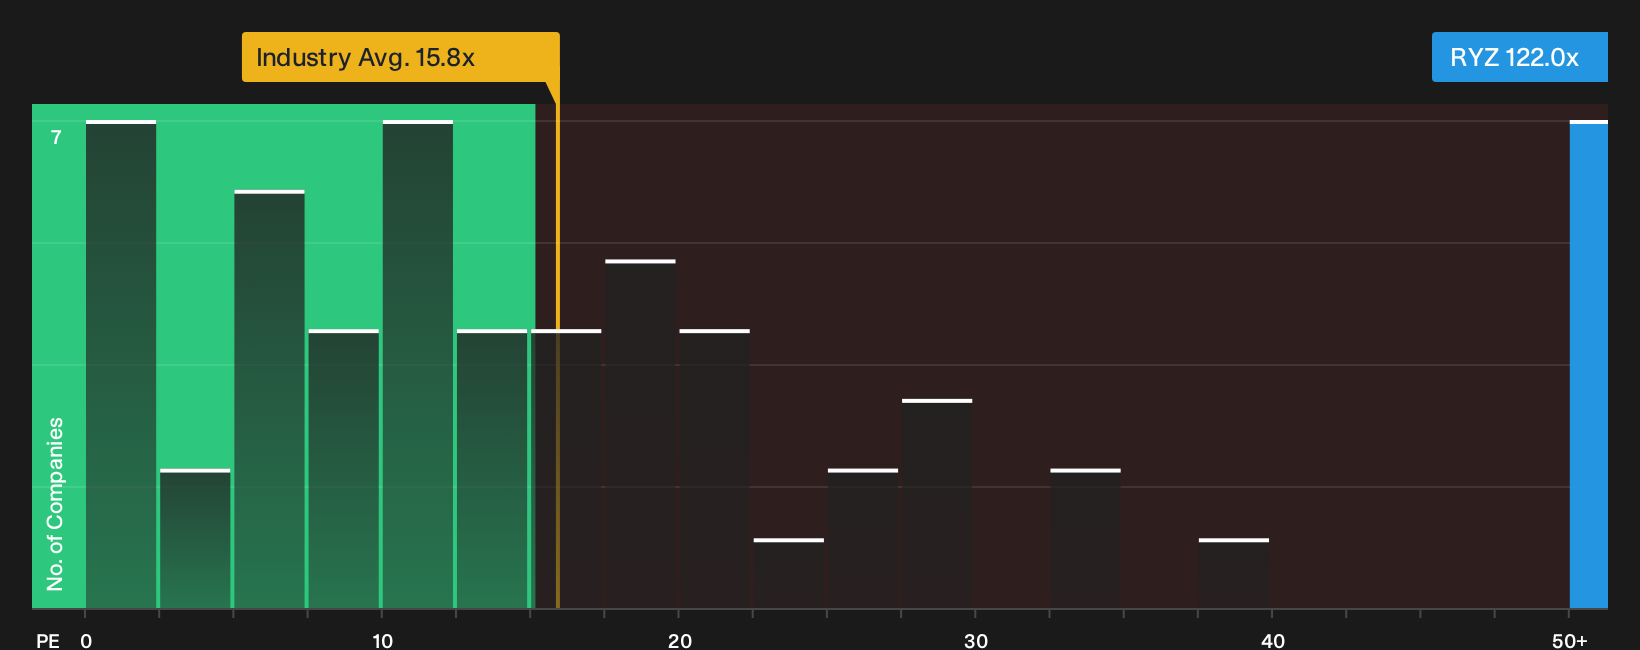
The P/E ratio fits Ryerson Holding because recent profit is front and center in how the market is weighing the Olympic Steel merger and metal demand. On that metric, the stock trades on about 122.0x earnings, compared with an industry average of roughly 15.8x and a peer figure near 40.3x. That is a very wide gap for a metals and mining business, so you are paying a high headline price for each dollar of current profit.
Because the latest quarter beat guidance and highlighted merger synergies, the market appears willing to assign Ryerson Holding a premium multiple despite the sector’s much lower norm. The DCF output and free cash flow history included above indicate that investors are not just paying for today’s numbers but are effectively pricing in a demanding path for future cash generation. For anyone assessing the shares, the key question is whether earnings quality and the merger trajectory justify such a rich P/E tag relative to metals peers. Explore the numbers behind Ryerson Holding's P/E valuation.
The Ryerson Holding Narrative: What Would Justify Today's Price?
Narratives for Ryerson Holding pick up where the valuation puzzle leaves off and spell out what would need to happen to growth, margins and earnings for the shares to be worth materially more or less than today’s price, all hosted on Simply Wall St's Community page. Rather than anchoring on a single P/E or one discounted cash flow output, each scenario lays out its own set of assumptions so you can later compare those reference points with how Ryerson Holding's reported numbers evolve.
A clear, number-driven Narrative on Ryerson Holding now gives you a reference point for whether the current P/E and merger story still stack up against the latest revenue of US$2.18b, net income of US$32m and early Olympic Steel synergy benefits. It turns those assumptions about earnings power, cash generation and whether the merger synergies hold up into something you can test as fresh results and integration updates arrive.
Share your own Narrative for Ryerson Holding and set out the assumptions behind your valuation.
One more side of Ryerson Holding that could change your view
Valuation only tells part of the story for Ryerson Holding, because independent checks have also picked up specific risk signals that deserve a closer look before you form a full view. Take a closer look at 4 warning signs (4 major) before settling on a valuation.
Have feedback on this article? Concerned about the content? Get in touch with us directly. Alternatively, email editorial-team@simplywallst.com