
Valaris’s (NYSE:VAL) Q3 2026 sales top estimates

Offshore drilling contractor Valaris (NYSE:VAL) reported Q3 2026 results topping the market’s revenue expectations, but revenue was flat year on year at $593.6 million. Its GAAP profit of $0.66 per share was 37.9% below analysts’ consensus estimates.
For more on Valaris, read our free full research report.
Valaris (VAL) Q3 2026 highlights:
- Revenue $593.6 million vs S&P analysts’ consensus estimates of $573.4 million (flat year on year, 3.5% beat)
- EPS (GAAP) $0.66 vs analysts’ consensus estimates of $1.06 (37.9% miss)
- Operating margin 13.7%, down from 21.9% in the same quarter last year
- Free cash flow -$54.4 million, down from $128.3 million in the same quarter last year
- Other production rose 29.2% year on year
- Market capitalization $7.31 billion
Dibowitz continued, “The outlook for our business is increasingly positive. The pipeline of deepwater opportunities remains robust, the opportunities continue to convert to contracts, and day rates are moving higher, driven by favorable market fundamentals and strong customer demand for high-specification drillships.”
Revenue growth
Cyclical industries such as energy can make mediocre companies look strong for a time, but a long-term view reveals which businesses can withstand and adapt to changing conditions. Over the last five years, Valaris grew its revenue at a decent 11.8% compounded annual growth rate. Its growth was slightly above that of the average energy upstream and integrated energy company, showing its offerings resonate with customers.
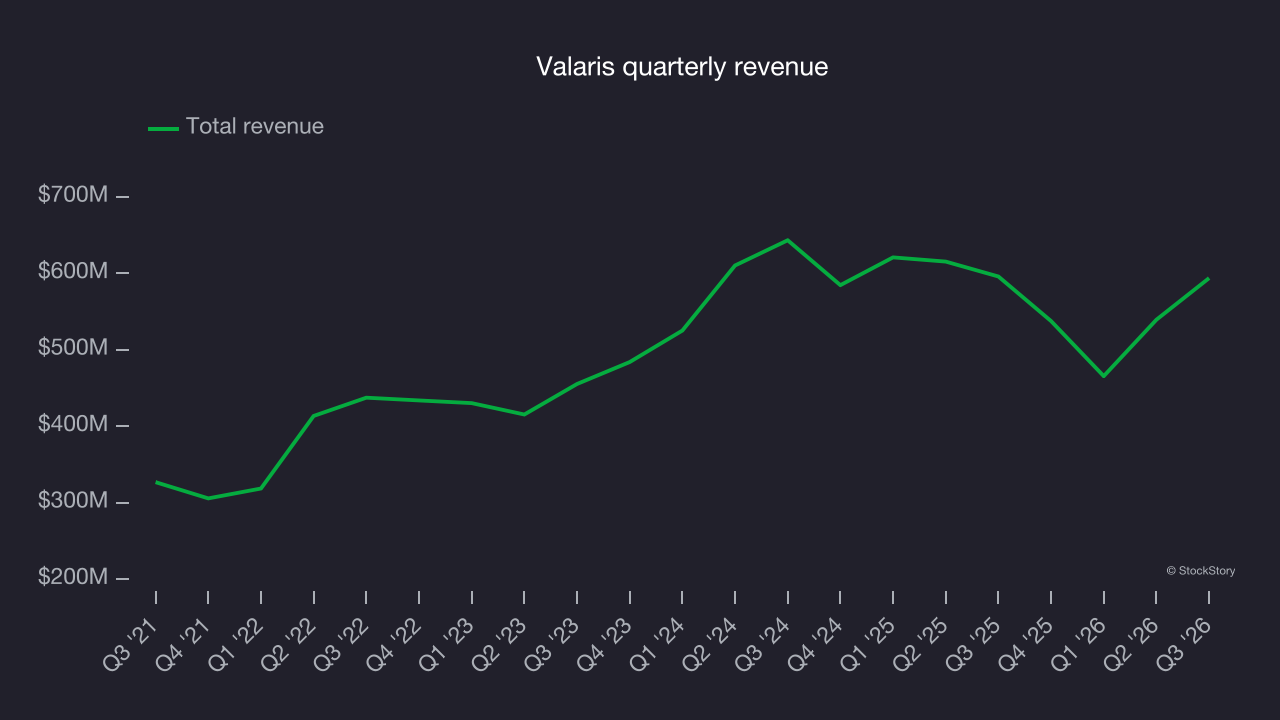
Within energy, a single time frame, even a long one, only sheds light on how well a company rode the last commodity cycle. To better assess whether a company compounds through cycles, a longer, ten-year view helps test that assessment. Valaris’s ten-year performance marks a sharp contrast with its five-year trend, as its revenue declined at an annualized rate of 3.7% over the last ten years.
While looking at revenue is important, it can also introduce noise around commodity prices and M&A. Analyzing production, on the other hand, highlights what is happening inside the asset base and whether the economic footprint of a company is expanding. Over the last two years, Valaris’s other production averaged 81.1% year-on-year growth.
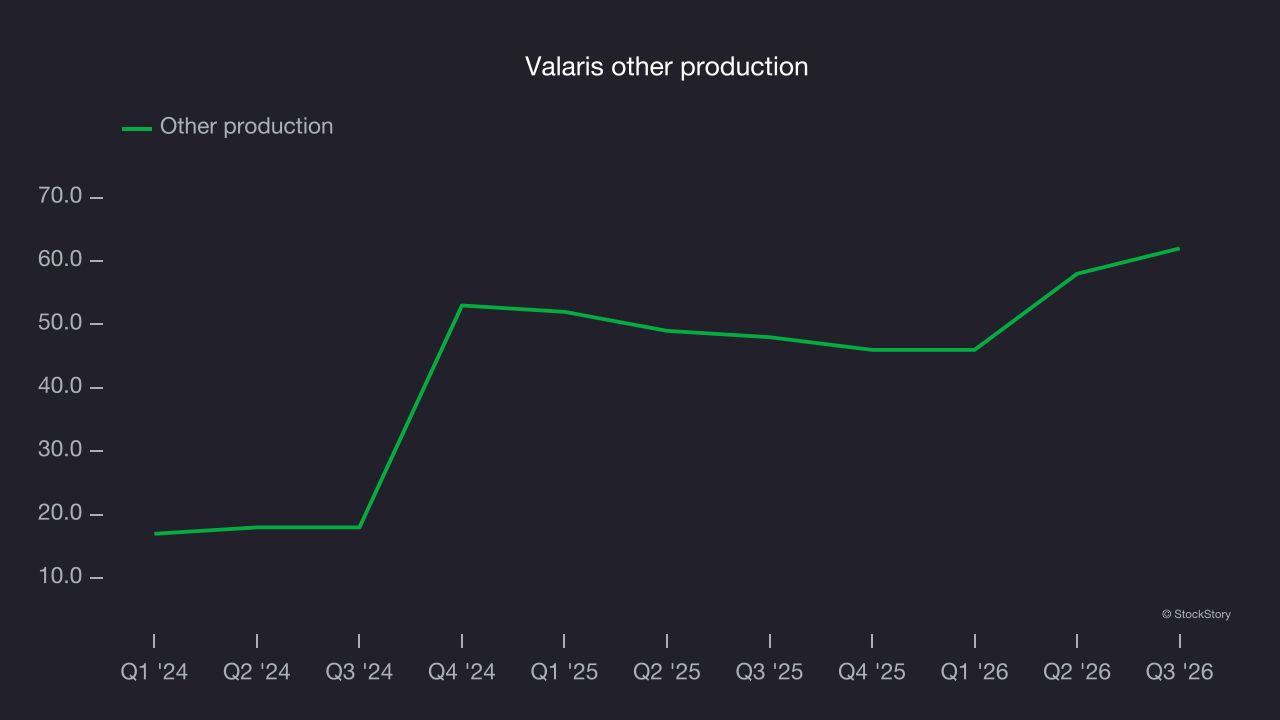
This quarter, Valaris’s $593.6 million of revenue was flat year on year but beat Wall Street’s consensus estimates by 3.5%. The company also reported year-on-year other production growth of 29.2%.
Adjusted EBITDA margin
Valaris was profitable over the last five years but held back by its large cost base. Its average EBITDA margin of 17% was among the worst in the energy upstream and integrated energy sector.
On the positive side, Valaris’s EBITDA margin rose by 13.5 percentage points over the last year.
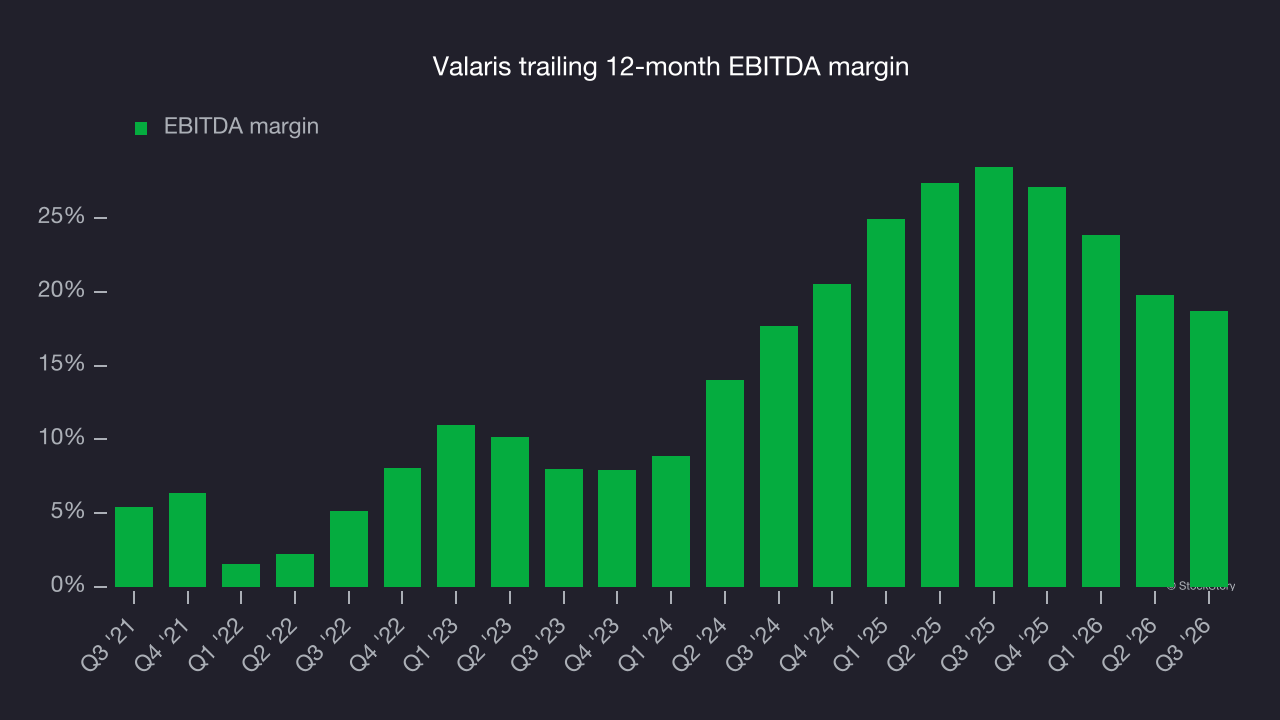
This quarter, Valaris generated an EBITDA margin of 23.5%, down 3.9 percentage points year on year. This contraction shows it was less efficient because its expenses increased relative to its revenue. Its adjusted EBITDA fell short of Wall Street’s consensus estimates.
Free cash flow
Adjusted EBITDA shows how profitable a company’s existing wells are before financing and reinvestment decisions, but free cash flow shows how much value remains after paying the cost of replacing those wells. In upstream energy, production naturally declines over time, so companies must continuously reinvest just to stand still. A producer can report strong EBITDA margins yet generate little or no free cash flow if its wells decline quickly or if new drilling is expensive. Free cash flow therefore captures not only how efficiently a company produces hydrocarbons today, but also how costly it is to sustain that production into the future.
Valaris’s heavy reinvestment needs have drained its resources over the last five years, creating financial strain and limiting its ability to return capital to investors. Its free cash flow margin averaged negative 6.1%, meaning it used $6.10 of cash for every $100 in revenue.
The level of free cash flow is important, but its durability across cycles is just as critical. Consistent margins are far more valuable than volatile swings driven by commodity prices.
Valaris’s ratio of quarterly free cash flow volatility to price volatility for West Texas Intermediate, or WTI, crude over the past five years was 25.7 (lower is better), indicating that its cash generation is far more sensitive to commodity-price swings than most peers. This elevated volatility limits its access to capital in downturns and makes it unlikely to act as a consolidator when weaker competitors come under pressure.
Why assess Valaris’s stability against WTI crude prices using free cash flow rather than revenue or EBITDA? What ultimately matters is not how much revenue or profit a company earns when prices are high but how much cash it can generate when prices are low. Free cash flow is the superior metric because it includes everything from hedging effectiveness to growth and maintenance capex to management behavior during good times and bad.
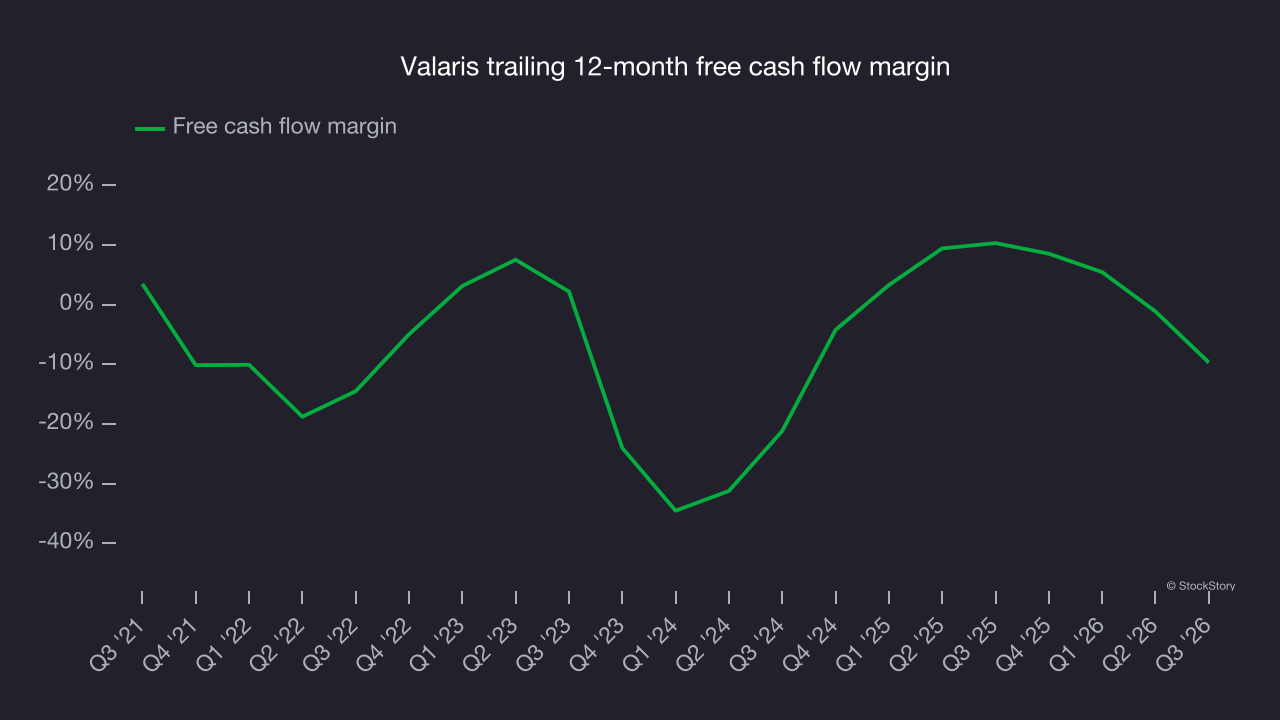
Valaris used $54.4 million of cash in Q3, equivalent to a negative 9.2% margin. The company’s cash flow turned negative after being positive in the same quarter last year, warranting closer attention. Short-term fluctuations typically aren’t a major concern because investment needs can be seasonal, but whether the trend continues into future quarters bears watching.
Key takeaways from Valaris’s Q3 results
Valaris’s revenue beat analysts’ consensus estimates, but the EPS miss left the quarter on a mixed note overall. Shares remained flat at $95.26 immediately after the results.
Evaluating Valaris at its current price calls for considering valuation, business quality and the latest earnings. For more on Valaris, read our full research report here (it’s free).